Debugging a JSP
When a breakpoint is added, it is not necessary to redeploy the Web application:
| From the RedBank index page, select the RedBank tab. |
| On the redbank page, enter a Customer ID of 444-44-4444, and click Submit. This executes the listAccounts.jsp file and hits the new breakpoint. |
| In the Confirm Perspective Switch dialog, click Yes to switch to the Debug perspective. |
| Execution should stop at the breakpoint set in the listAccounts.jsp, because clicking Submit in the application attempts to display the accounts by executing this JSP. The thread is suspended in debug, but other threads might still be running (Figure | 4-14). |
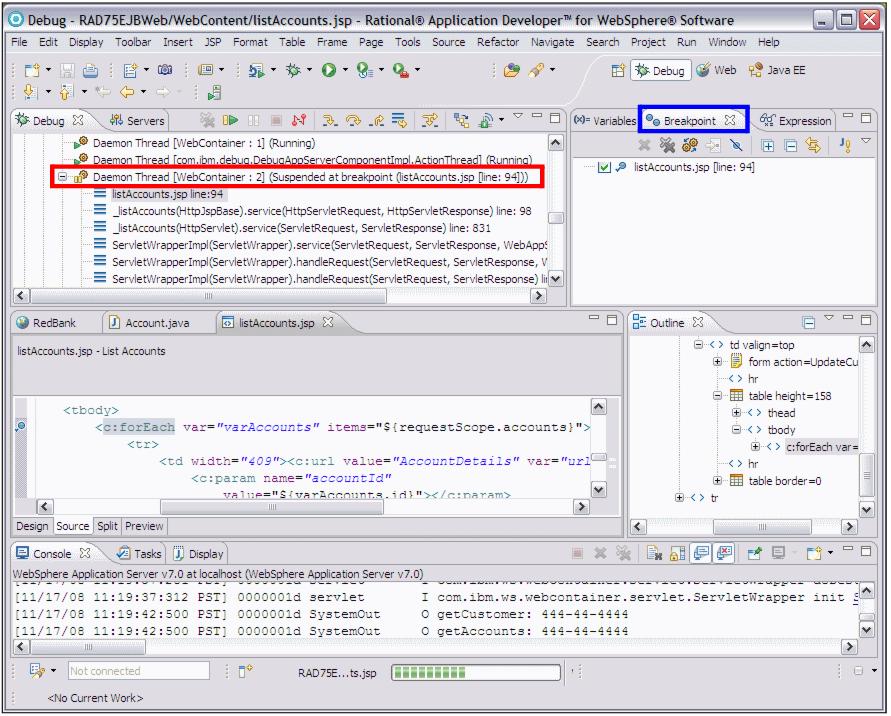
Figure 24-14 Debugging a JSP
|
Note: If you have two JSPs with the same name in multiple Web applications, the wrong JSP source might be displayed. Open the correct JSP to see its source code. |
| After a breakpoint is hit, you can analyze variables and step through lines of the JSP code. The same functions available for Java classes are available for JSP debugging. The difference is that the debugger shows the JSP source code and not the generated Java code. |
| The JSP variables are shown in the Variables view. Note that the JSP implicit variables are also visible, and it is possible to look at things such as request parameters or session data (Figure | 4-15). |
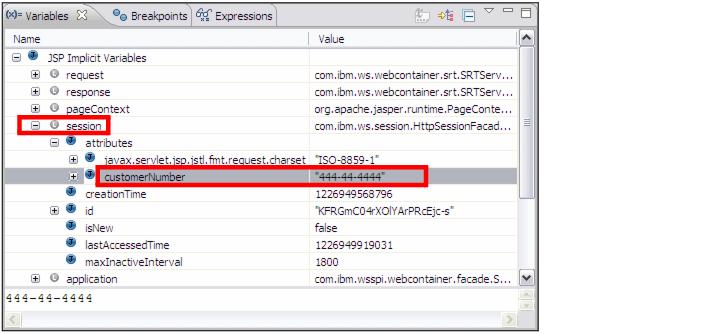
Figure 24-15 JSP Implicit variables in Variable view
| Step over the lines within the JSP by pressing the F6 key (Step Over). Notice that the debugger will skip any lines with only HTML code. |
| Observe the change in the variables view. Expand JSP Implicit Variables Ć pageContext Ć page_attributes and select varAccounts, which is the variable in the <c:forEach var="varAccounts"...> loop: |
Account: 004-444001 balance 987.65
| The customer and the accounts are visible under JSP Implicit Variables Ć pageContext Ć request_attributes. |
Click Resume ( ) allow the application to continue with the JSP page generation. ) allow the application to continue with the JSP page generation.
|
| Remove the breakpoint. |
This concludes the section on debugging a local test environment.
|
ibm.com/redbooks |