Test results analysis reports
Reporting in Rational Performance Tester
| Test case generation | Gather the requirements and come up with test cases to emulate the actual workload. |
| Server assignment | Assign servers for test purposes. |
| Test recording and configuration | Start recording and configuring the test environment. |
| Emulate the workload and playback | Stage where the actual load is pumped in based on the test cases generated. |
| Report generation | Identify application- or system-level bottlenecks. |
Use the performance analysis reports obtained from each run to determine the health of an application for a particular iteration.
| Find bottlenecks | We can provide feedback to developers on an application bottleneck as early as possible based on the performance analysis reports that you generate. |
| Finding breaking points for an application | Discover a component that breaks for a particular load, after the initial load was perfect. A use case for this scenario may be workload increase after the initial deployment. |
Overview
The examples below use the standard test application DayTrade as the application under test.
This tutorial discusses the following reports...
- Performance report
- Page Element report
Citrix and SAP reports are outside the scope of this tutorial, and therefore will not be discussed.
Analysis Reports: Introduction
Rational Performance Tester performance test results appear in hierarchical order under the project name. Because reports are for the most part made up of counters, it is natural to consider some of the available counters provided in Rational Performance Tester. The generic counter is listed as the first category in the Performance Test Runs view.
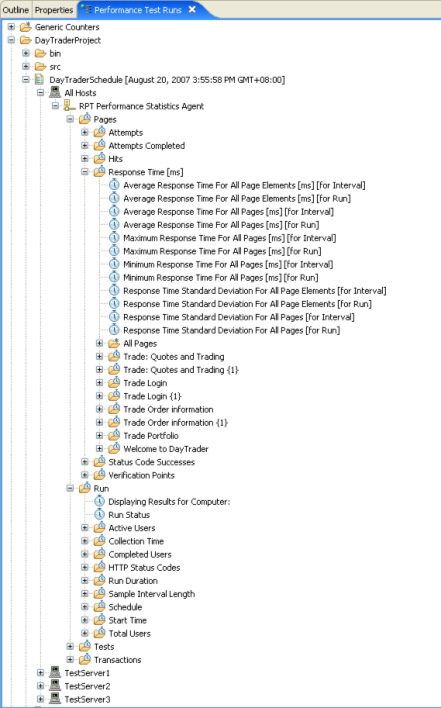
However, if you simply navigate to and double-click your test run result counters under All Hosts, that will not bring up a report (this tutorial will show you how to get to the reports in the How to navigate to the reports section that follows). These counters in the Performance Test Runs view merely serve as containers. The generic counter can be divided into HTTP, Citrix, and SAP counters. HTTP counters, for example, are composed of the following categories.
Page Counter
| Page/element Attempts | Attempts rate, the count between a run or an interval for all pages and all elements. |
| Page/element Attempts Completed | Count for attempts completed. |
| Page/element Hit Rate | Hit rate per page/element, or the total page/element within a run or an interval. |
| Response Time | Average and maximum response time for page/element. |
| Status Code Successes | Percent and total page/element success rate. |
| Verification Points | Percent and total page/element verification that indicates a pass, fail, or inconclusive result. |
Run Counter
| Total User | Total users involved in the run. |
| Active User | Count of the users who are currently active. |
| Completed User | Count of total users who completed the test run. |
| Status Codes | Count of the HTTP status code (that is, 100, 200, 300, 400, and 500 status codes) within a run or an interval. |
| Run Duration | The duration of the run. |
| Test Counter | Average, minimum, maximum, and standard deviation for execution time for a run, provided either as scalar or aggregate manner. |
Transaction Counter
| Attempts | Total transactions that were attempted for a run or an interval. |
| Completed | Total transactions that were completed for a run or an interval. |
| Execution Time | Average, minimum, maximum and standard deviations for an individual transaction, or all transactions, within a run or an interval. |
Types of Reports
Rational Performance Tester provides application- and resource-level analysis reports. Application analysis reports have everything to do with application system performance-related issues, such as page or page element response time, page hit, page or page element throughput, and so on. On the other hand, resource analysis reports relate system resources utilization such as CPU, memory, disk, and network throughput. Currently, there are three resource monitoring data collected:
- IBM® Tivoli® Monitoring (ITM)
- Microsoft®Windows® Performance Monitor (PerfMon)
- Linux®/UNIX® rstatd
In Rational Performance Tester, the performance test reports that are provided are HTTP, SAP, and Citrix, of which the latter two require extensions (SAP and Citrix reports will not be discussed in this tutorial). HTTP performance reports will be discussed in greater detail in the following sections, and are summarized in Table 1.
| Report Category | Report Tab Name | Description |
|---|---|---|
| Performance Report | Overall | An overview of how test pages are doing overall; it includes success rate in percentage for Page Status Code, Page Element Status Code, and Verification Point (VP) Status. |
| Summary | A quick summary of three categories of summaries (Run Summary, Page Summary, and Page Element Summary) that gives you a high-level insight into the test run. | |
| Page Performance | Performance summary rendered in a bar chart detailing the response time for the slowest 10 pages. | |
| Response vs. Time Summary | A summary of page performance presented as a line chart, averaging response time for all pages and page elements for a given interval. | |
| Response vs. Time Detail | A trend analysis report graphed with each page per line, in which each point represents the response time per interval. | |
| Page Throughput | Page hit rate and count per interval, with user load given alongside. | |
| Server Health Summary | A summary of system health, with the focus on page and page element health. | |
| Server Health Detail | A health detail report featuring 10 pages with the lowest successes. This includes counters such as the attempt and hit count per page. | |
| Resources | Show the resource counter monitored. | |
| Page Element Report | Overall | Show the average response time for all page elements for a given interval. |
| Response vs. Time Summary | Graph the average response time per page element for the 10 slowest page elements for a specified interval. | |
| Response vs. Time Detail | List the average response time for each page element, in detail. | |
| Page Element Throughput | A two-graph trend analysis report graphed in a given interval for page element hit rate and user load, respectively. | |
| Server Health Detail | Show the success rate in percentage for the 10 slowest page elements during the test run. |
How to navigate
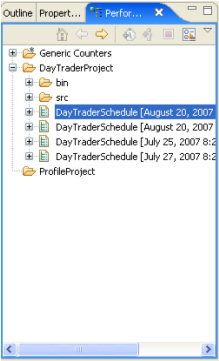
Various performance-related reports are generated and saved automatically. One quick way to gain access to these reports is to view reports via the Performance Test Runs view. By default, this view is available from the bottom left panel (if you have closed it, you can go to menu bar and select...
-
Window | Show View | Performance Test Runs
During performance test runs, the test results are automatically populated in the test administration server for further analysis. Each performance test run results in a line item in the Performance Test Runs view, including the timestamp of the actual run.
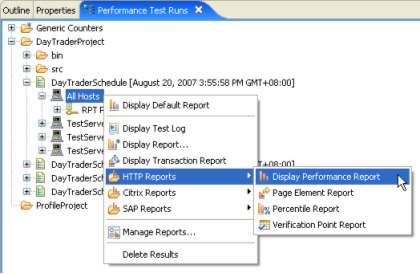
The simplest way to navigate to the record is to expand the desired performance test run result, and then right-click the All Hosts icon for a list of reporting options. Remember that reports are divided into categories, and each category contains tabs with unique names. For example, the first option (Display Default Report) displays the default report, which is the HTTP Performance Report. Alternatively, the Performance Report can be obtained by selecting...
-
HTTP Reports | Display Performance Report
Likewise, page element, percentile, and verification point reports can be obtained in similar manner.
There are also the Display Report and Display Transaction Report options.
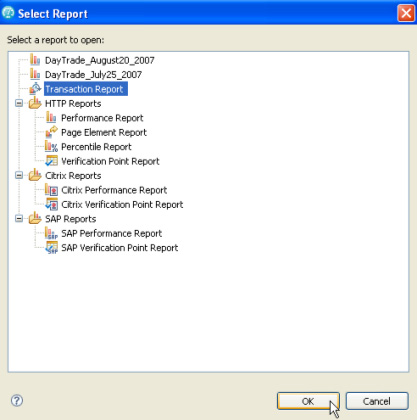
For example, to display the Transaction Report, you can either select...
- Display Transaction Report
- Display Report (lists Transaction Report as one of the report options)
Display Report allows us to select from all of the available reports, including your custom reports.
Analysis reports: demystifying performance reports
This section will explain performance reports (although many of them are self explanatory) by focusing on and explaining the content of each report. In order to pinpoint performance bottlenecks, analyzing the correct reports is essential. You will be viewing the default report presentations in this section; the customizations of these reports are discussed in Part 5 of this series.
Formal Definitions
| Interval | Interval for statistical sampling. This value depends on the Statistics sample interval value that you set for the schedule. |
| Attempt | An attempt is a request sent. |
| Hit | A hit is when the server received a request and returned a response based on the request. |
| Standard Deviation | Deviation of data from the mean. |
| Status Code Success | A success refers to the response code verification point passed for a request. In the absence of a verification point (not enabled), a status code success means that the server received a request and returned a response where the status code was in the 200 or 300 category, or returned an expected response in the 400 or 500 category. |
| Response time | The time between the first request character sent and the last response character received. |
Performance Report
Performance Report is the default report displayed after a test run. It gives a summary of important information (such as run, page, page elements, and transaction summary), together with the details on page health checks (such as response time breakdown and workload trend). As you saw in Table 1, there are nine analysis reports (each with its own tab) that fall under this category.
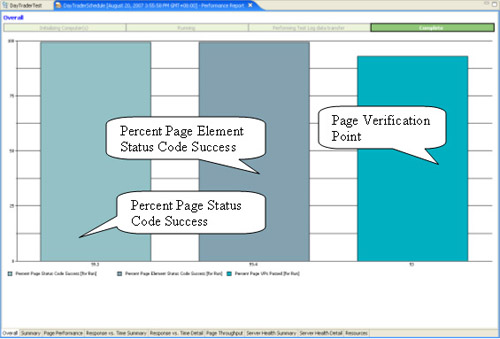
Overall
This is the report shown during a test run, and it includes a progress bar that indicates the stages in the test run. Without the progress indicator, which shows...
- Initializing Computer(s)
- Running
- Performing Test Log data transfer
- Complete
...it is difficult to see that a long-running test run is still in progress. Therefore, you could easily mistake a long-running test for a hung process.
This report includes percent page status code success, percent page element status code success, percent page verification points passed rates, and response code or response size verification. The first two bars are always there. However, the third or fourth bar is only available when verification points are enabled.
Under a normal test run, factors such as user think time, delay time, and server resources under test can affect the success rate of page and page element codes. Percent Page Status (as the primary request) is usually lower than Percent Page Element Status. This is because a page consists of multiple elements, and a failure on an element constitutes a failure in the primary request.
In order to qualify as a pass for Page Status Code, the primary request return code for a page has to fall between 200 and 300, (with verification disabled in the main page). However, with verification enabled in the main page, the main request inherits a status code of 200 (HTTP V1.1) by default (which you can modify to suit your test environment by navigating down the primary request).
Page Verification Point success rate, on the other hand, depends on page title, content, response code, and response size specified. You will explore verification reports in greater detail in Part 5 of this series.
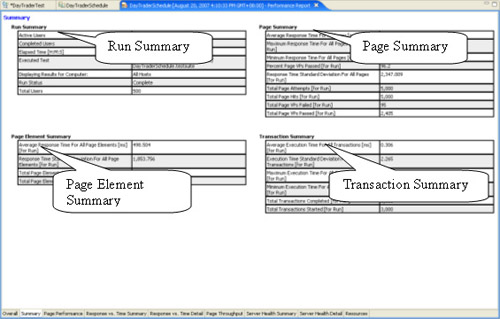
Summary tables
The summary tables give you a quick overview of the performance test run. By default, without transaction results being added, you can find three summaries under this tab. In this test run, because the transaction reports were added, four summaries are available.
Run Summary
| Active Users | The active users currently under test run. This number is meaningful when the test run is in progress. When a test run is completed, this number is reduced to 0. |
| Completed Users | Under normal circumstances, this number increases in proportion to the number being decreased for active users. Upon test run completion, this number should be equal to the Total Users under test. |
| Elapsed Time [H:M:S] | Total run duration displayed in Hour:Minute:Second format. This time indicates the duration from the start to the end of a test run. |
| Executed Test | The test under the test run. This is a quick indicator to show which test is under a project, because many tests can co-exist. |
| Display Results for Computer | By default, this value is set to All Hosts. We can drill down to the performance report for each individual machine. |
| Run Status | Usually Complete upon a test run completion. Particularly useful during a test run (other than using the progress bar) to indicate the progress of a test run. Valid values that may be displayed are Initializing Computers, Running, Transferring data to test log, Stopped, and Complete. |
| Total Users | This is the total user load. Under normal circumstances, this figure will tally with Completed Users. |
Page Summary
| Average Response Time for All Pages [ms][for Run] | A page response time is the sum total of the time taken for each element within a page to respond to a request. This value indicates the average response time in milliseconds for all the pages under test. |
| Maximum Response Time for All Pages [ms][for Run] | This indicates the maximum response time for all pages. |
| Minimum Response Time for All Pages [ms][for Run] | This indicates the minimum response time for all pages. |
| Percent Page VPs Passed [for Run] | This is the same figure provided by the verification point bar in the Overall tab. Once enabled, this figure shows the total verification point success rate. |
| Response Time Standard Deviation for All Pages [for Run] | This figure shows the deviation from the mean of the average response time for all pages. |
| Total Page Attempts [for Run] | The sum total of page attempts made. A page attempt is a request to the server from a primary page, excluding the page elements. This value shows the request without awaiting the response sent from the servers. |
| Total Page Hits [for Run] | The sum total of page hits. A page hit implies a round-trip of a request (originated from primary pages) and response (from the servers). This value should tally with Total Page Attempts in normal circumstances. |
| Total Page VPs Failed [for Run] | If set, this value indicates the total number of verification points that failed for primary pages. |
| Total Page VPs Passed [for Run] | If set, this value indicates the total number of verification points that passed for primary pages. |
Page Element Summary
The same information as for Page Summary is available here, except that it is for page elements in total.
Transaction Summary
| Average Execution Time for All Transactions [for Run] | This is the average execution time for all of the transactions defined in a test run. |
| Execution Time Standard Deviation for All Transactions [for Run] | This is the deviation from the mean for all transactions. |
| Maximum Execution Time for All Transactions [ms][for Run] | This is the maximum execution time for all transactions. |
| Minimum Execution Time for All Transactions [ms][for Run] | This is the minimum execution time for all transactions. |
| Total Transactions Completed [for Run] | This is the total number of transactions completed during a test run. This value should tally with the Total Transactions Started under normal circumstances. |
| Total Transactions Started [for Run] | This is the total number of transactions started during a test run. |
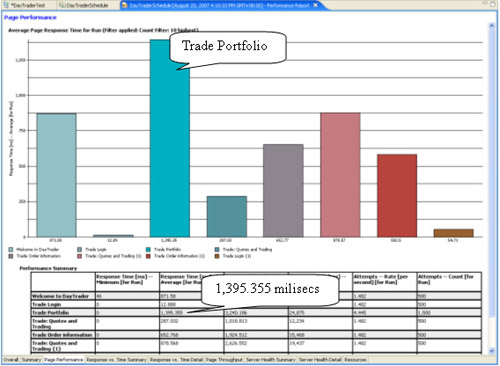
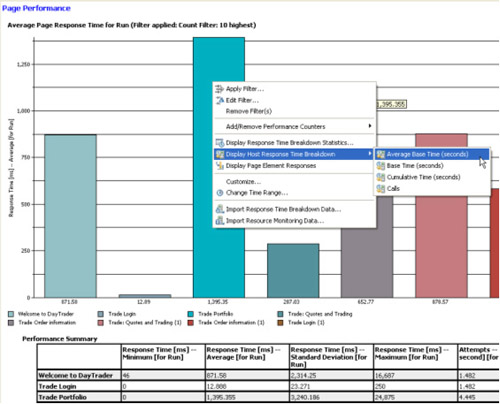
Page performance
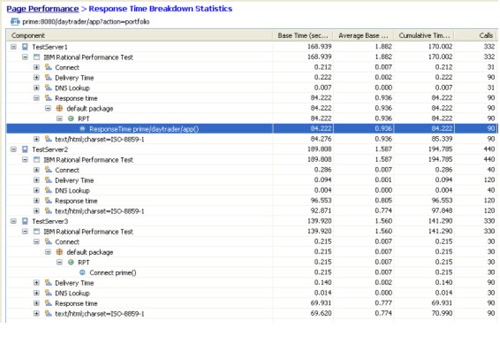
Because it shows the slowest 10 pages (for an application under test that spans more than 10 pages), this report is best used to identify the slowest primary pages. With one glance, you can immediately identify the pages (using the bar chart) that take the longest time to respond to a test run. This report comes with both bar charts and page response time counters in tabular format. The response time counters (such as minimum, maximum, average, and standard deviation) are provided. This is one easy way to identify a performance bottleneck. For example, in this scenario, the third page (Trade Portfolio) has the highest response time in milliseconds.
The default display for the response time breakdown statistics are:
| Method | Method being invoked. |
| Class | Class being invoked. |
| Package | Packages of the classes involved. |
| Base Time | Total time spent inside this object, not counting the time that this object used to invoke other objects. |
| Average Base Time | Base time divided by total calls. |
| Cumulative Time | Total time spent inside this object, and the time this object used to invoke other objects. |
| Call | Total number of times the object is invoked by other objects. |
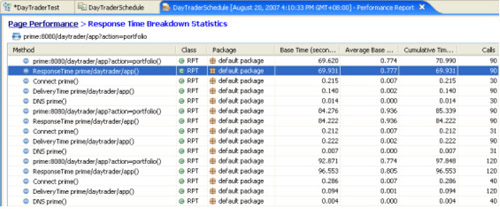
The Page Performance report allows us to drill down further to the page element level. It also allows us to drill down from the page element to individual host, application, component, package, class, and method response times for a particular page element.
- For example, right-click a bar and select...
-
Display Response Time Breakdown Statistics
This brings us to a response time breakdown for page elements.
- To see the response time breakdown for a particular page element, select the element by highlighting it in the Page Element Selection wizard, and then click Finish to obtain the breakdown.
There is more than one way to drill down to individual host, application, component, package, class, and method response times.
- Another way is to right-click to select...
-
Display Host Response Time Breakdown
- To navigate to the method level, continue to right-click and use the menu options until you get to method level.
Response vs. Time
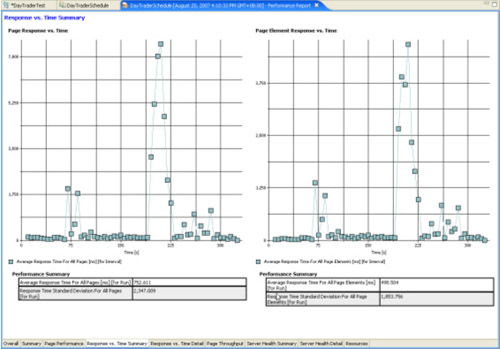
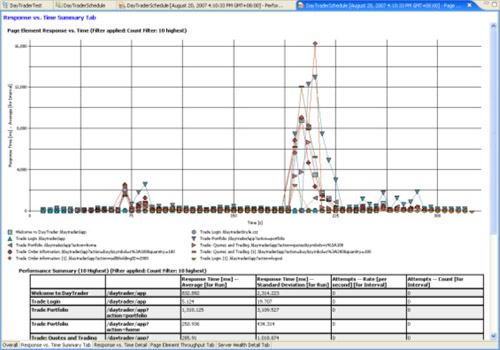
The Response vs. Time Summary report, shown below, is a summary of average response time and response time standard deviation for all pages and page elements. On the left is the average response time for all pages. Each point represents an average response time for a given interval. The default interval is 5 seconds. We can set this interval in the test schedule, under Schedule Element Details > Statistics > Statistics sample interval.
The right graph shows the average response time for all page elements for a given interval. Usually, these two graphs are similar, because a slow page element response will inevitably create a slow page response. To identify any anomalies, look for a spike in the graphs (if there is any).
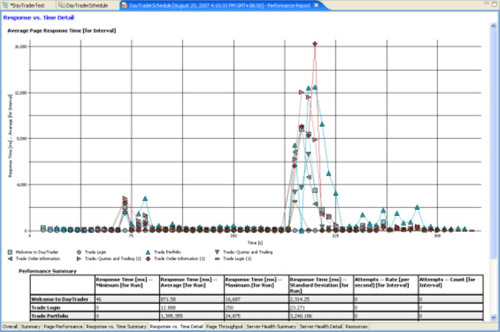
Response vs. Time Details is a line graph that shows the average page response time for all pages. Each page is represented by a symbol. For example, in this scenario, the primary page, Trade Order Information is represented by a red cross, as shown below. In addition, each point represents an interval for the duration of the test run.
The table at the bottom of the screen, on the other hand, gives page response information (such as minimum, maximum, average, and standard deviation response times, and so on) for all pages.
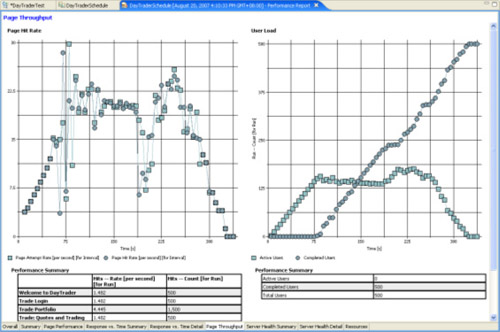
Page Throughput
This report, shown below, is two line graphs that show page hit rate and user load, respectively. The left graph shows the page attempt and page hit rate for a given interval. An attempt is the request being sent by a primary page, and a hit is the response from the server upon a request. Naturally, these two lines should stay close to one another, because an attempt will usually correspond to a hit.
If the workload increases without a proper server sizing, however, the number of attempts increases while the number of page hits decreases. When this happens, either scale up the server under test or re-allocate user workload to another server.
The right graph displays the active and completed users for a test run represented in intervals. In this scenario, active users were being loaded up around 150 before any user reached completion at 75 seconds. The active users stabilized at around 150, while the completed user line graph shows a healthy linear increase. We can easily identify an overloaded situation (a combination of high user workload and server capacity) from this graph.
Server health
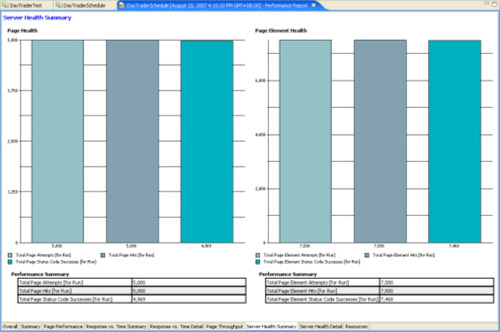
The Server Health Summary report, shown below, provides you a summary of server health under test by displaying page and page element related information. These graphs indicate either that workload is too high (parameters such as user think time and start delay time can affect the workload), or that the server lacks the capacity to handle the workload.
The default page counters available in this report are page/page element attempts, hits, and status code successes. The left bar graph shows the page information, and the right graph shows page element information.
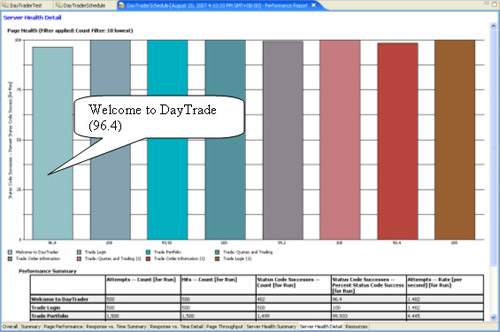
The Server Health Detail report, shown below, is a graph that shows the 10 slowest pages by detailing each page's percent status code success for the test run. A successful status code refers to the HTTP response code passing if a verification point is set for that particular page. In the absence of a verification point, a successful status code falls in the range between 200 and 300.
The information included in the tabular format includes attempts, hits, status code successes count, percent status code success, and so on.
In this scenario, the page Welcome to DayTrade has a percent status code success of 96.4. After observing this, you can investigate further by reviewing the test log for this test run.
Resources
This report will only be meaningful if you turn on IBM Tivoli Monitoring, Windows Performance Monitor (PerfMon), or Linux/UNIX rstatd resource monitoring. Otherwise, this report will show a blank page.
Page Element Report
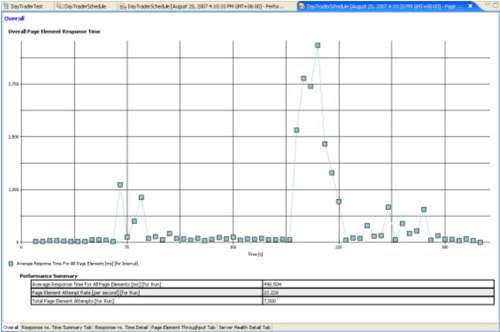
Overall
This line graph, shown below, displays all page elements versus time. Page elements are, for instance, images, sidebars, buttons, and application scripts that are considered elements of a Web page. The following information is included in the Performance Summary table:
| Average Response Time for All Page Elements | Each page element's average response time in milliseconds is added together to provide this figure. This figure shows the total of the page elements average. |
| Page Element Attempt Rate | In each second, how many page elements were sent to the server for processing. |
| Total Page Element Attempts | This is the total number of page elements that were sent to the server for processing in the entire run. |
In order to view each element's results in detail, look at the tabs on Response vs. Time Summary, Response vs. Time Detail, Page Element Throughput, and Server Health Detail.
Response time
The Response vs. Time Summary report, shown below, is a line graph that shows average response time versus time for each page element. Each page element is represented by a symbol that is described in the legend.
We can apply a filter to the result by count, value, or label. When you apply a filter, the result shows just the information that we need. For example, setting the filter by count to 10 highest response times shows you the top 10 slowest page elements. By knowing the slowest elements, you can take action to lower the response time (for example, use a smaller picture that loads faster).
The following information is included in the Performance Summary table below with a count filter of 10 highest (meaning the 10 page elements that took the longest to respond).
The two left-most columns show the parent page and the element name that was measured.
| Response Time - Average for Run | Each page element can be sent to the server and returned to the Web page more than one time. Each time, the response time is recorded and then averaged to provide this figure. |
| Response Time - Standard Deviation for Run | Imagine the Bell curve and draw a vertical line across the middle to show the mean of the average response time of each element. This figure shows the deviation from the mean. A bigger deviation number means that there was less consistency in the response time, and a smaller deviation number means more consistency. |
| Attempts - Rate for Interval | Interval means the time span for which Rational Performance Tester records results on the graph. As such, this figure shows the attempt rate in seconds sent to the server at the sample interval. |
| Attempts - Count for Interval | The number of times the page element was sent to the server at the sample interval. |
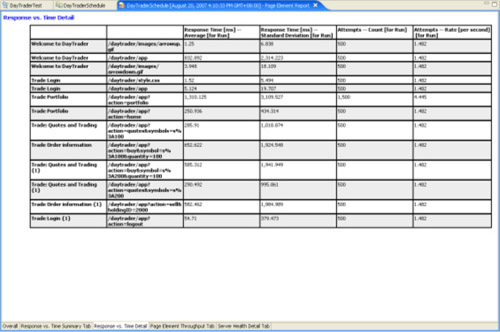
The Response vs. Time Detail graph, shown below, displays all of the page element readings in the run. The following explain the report table attributes:
The two left-most columns show the parent page and the element name that was measured.
| Response Time - Average for Run | Each page element can be sent to the server and returned to the Web page more than one time. Each time, the response time is recorded and then averaged to provide this figure. |
| Response Time - Standard Deviation for Run | Imagine the Bell curve and draw a vertical line across the middle to show the mean of the average response time of each element. This figure shows the deviation from mean. A bigger deviation number means that there was less consistency in the response time, and a smaller deviation number means more consistency. |
| Attempts - Rate for Run | The attempt rate in seconds of the page element sent to the server in the entire run. |
| Attempts - Count for Run | In one second, the number of times the page element was sent to the server in the entire run. |
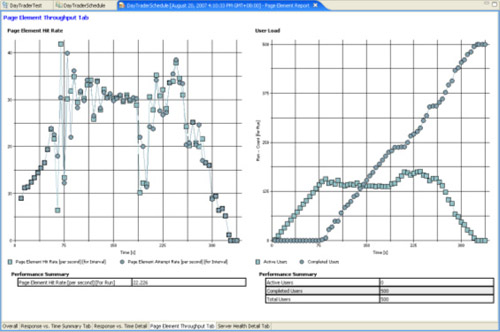
In this report, shown below, the left line graph shows the Page Element Hit Rate, and the right line graph shows the User Load. The following are the metrics being used:
| Page Element Hit Rate | This graph show counters versus time. Page element throughput means at that particular time interval, how many page elements were sent to the server, processed, and got a response. Interval means the time span for which Rational Performance Tester records results on the graph.
|
| User Load | This graph shows the user counter versus time. In the beginning of the run, you should see zero completed users and some active users. There will be a point in time when the completed user count increases and the active user count decreases until it reaches zero. Normally, you get a graph that looks like an X. The Performance Summary table shows the active users, completed users, and total users. |
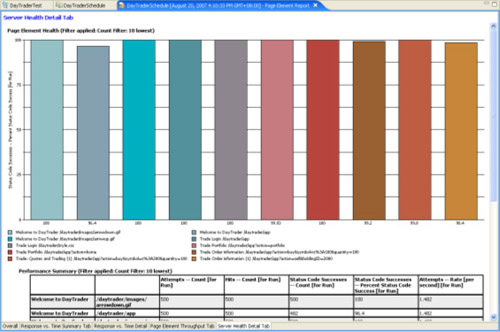
This bar graph, shown below, displays the percentage of successes for the page elements in the run. We can apply a filter to the result by count, value, or label. If you apply a filter, the result shows just the information that we need. For example, setting the filter by count to 10 lowest shows the 10 least successful page elements. These are the Performance Summary table attributes:
The first two left columns show the parent page and the element name.
| Attempts - Count for Run | The number of times the page was sent to the server. |
| Hit - Count for Run | The number of successful responses from the server. |
| Status Code Successes - Count for Run | When the server responds with the page element, this is the number of success code returns. It should match the Hit Count. |
| Status Code Successes - Percent Status Code Success for Run | The success rate as a percentage. The number should match the bar graph. |
| Attempts - Rate for run | In each second, how many of the page elements were sent to the server. |
Resources
Learn- Learn more on the Rational Performance Tester product page.
- Find detailed instructions for using Rational Performance Tester.
- Visit the Rational software area on developerWorks for technical resources and best practices for Rational Software Delivery Platform products.
- Subscribe to the IBM developerWorks newsletter, a weekly update on the best of developerWorks tutorials, articles, downloads, community activities, webcasts and events.
- Subscribe to the developerWorks Rational zone newsletter. Keep up with developerWorks Rational content. Every other week, you'll receive updates on the latest technical resources and best practices for the Rational Software Delivery Platform.
- Subscribe to the Rational Edge newsletter for articles on the concepts behind effective software development.
- Browse the technology bookstore for books on these and other technical topics.
Get products and technologies
- Download the trial version of IBM Rational Performance Tester.
- Download trial versions of other IBM Rational software.
- Download these IBM product evaluation versions and get your hands on application development tools and middleware products from DB2®, Lotus®, Tivoli®, and WebSphere®.
Notes
Default Windows preference for deciding when page has loaded is 5 seconds. If page takes longer than that, it loads two pages. To change, Click...
-
Window | Preferences | Test
Change Execution Save interval from 5000 to something higher.
On graph reports, select Time Range to zero in on a particlar time range.
Under Schedule Element Details, select "Enable resource monitoring". Select Add button to add machine or IP address. Use machine if possible. Multiple IP addresses might be merged together making deciphering difficult. Use machine names if possible. Modify you personal hosts file is required.