Correlation is the process of analyzing and determining a set of related events, based on a set of rules that are used to interpret the data contained in the events. The Log and Trace Analyzer enables you to correlate information within a log file from a single application or across multiple log files generated by different applications.
The Log and Trace Analyzer provides the following correlation methods:
The correlation types can be used together to provide a complete picture. For example, when grouping a set of events together you typically also order the events in the group.
The Log and Trace Analyzer provides two different views for displaying correlations:
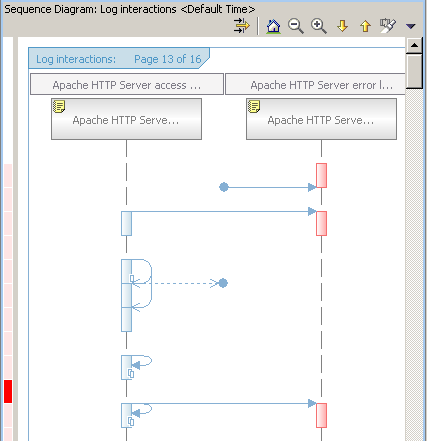
Here is an example of a log interaction diagram which illustrates the interactions between an access log and an error log:

The window title displays the view type and the correlation schema used in the format
Sequence Diagram: View name <Correlation schema>
where View name is the Log Interactions view or the Log Thread Interactions view
and the Correlation schema can be a predefined schema format such as Default Time.
Correlations are represented visually by an arrow that points from the source record to the target record. The following are different representations of correlations:


The time compression bar along the left edge of the diagram indicates the time elapsed between consecutive events. The time compression scale shows where the time falls between the minimum and maximum delta times. The intensity of the color is used to indicate the length of time, namely, the deeper the intensity, the higher the delta time.
Related tasks
Correlating log files
Using log interaction diagrams
Setting preferences for the Log and Trace Analyzer
Working with log files
Related reference
Log view
Log interactions view
Log thread interactions view