Execution statistics
The Execution Statistics view displays statistics about the application execution time. It provides data such as the number of methods called, and the amount of time taken to execute every method. Execution statistics are available at the package, class, method and instance level.
To analyze the execution statistics, in the Profiling Monitor view, double-click Execution Time Analysis, or click the  icon, or right-click the entry and select Open With Æ Execution Statistics.
| The Session summary and the Execution Statistics tab show the same data, using different filters. On the Execution Statistics tab you can set the filter, for example, No filter (our selection), Highest 10 base time (which is the filter for the Session summary), Highest 10 cumulative time, and so forth (Figure | 7-10). |
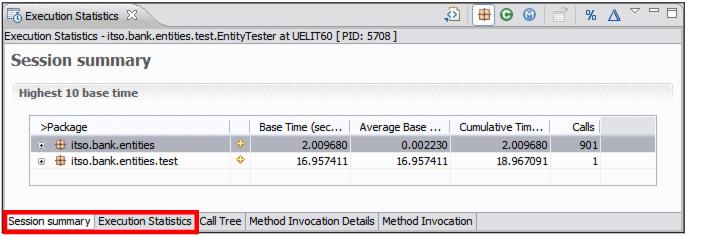
Figure 27-10 Execution time Statistics: Summary
| Expand the packages and classes to see the accumulated values per class or per method (Figure | 7-11). |
Notice the icons  to switch to package, class, method, and instance views, to open the source, to display data as percentages, and to add delta columns.
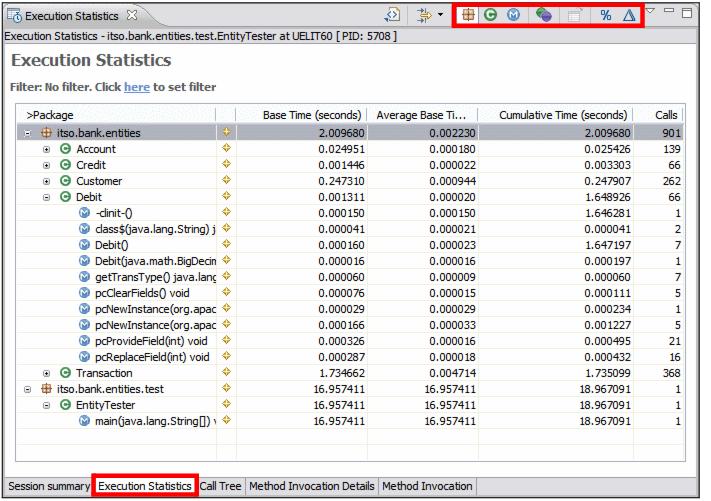
Figure 27-11 Execution Time Statistics: Expanded
| For each object type, the following statistics are displayed: |

|
|
|
|
|
|
|
|
Note: The JPA entity classes include a number of generated methods with the pc prefix that are generated for database access. |
|
ibm.com/redbooks |