Debugging a sample Jython script
In this section we debug the listJDBCProviders script that was described in Developing automation scripts:

| Open the listJDBCProviders.py Jython script file in the RAD75Jython project.
|
|
| Set a breakpoint in the showJdbcProviders function at the line:
|
for provider in providerEntryList
|
| Select listJDBCProviders.py and Run Ć Debug As Ć Administrative Script.
|

 Verify listJDBCProviders.py as Name.
|
|
Select WebSphere Application Server v7 as Scripting runtime and was70profile1 as the WebSphere profile.
|
|
Specify a User ID and password if security is enabled.
|
|
Click Apply, then click Debug.
|
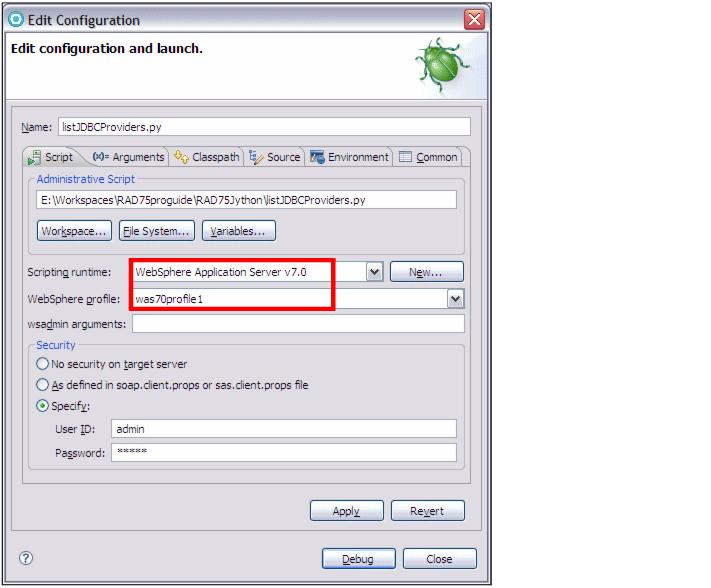
Figure 24-18 Jython debugging configuration
|
| Execution of the script starts and when the breakpoint is encountered execution is suspended.
|
|
The Debug view shows the thread and is used to step through the code.
|
|
The editor shows the source code and where we currently are.
|
|
The Variables view shows the Jython variables, which cannot be changed.
|
|
The Console shows the output of the script.
|
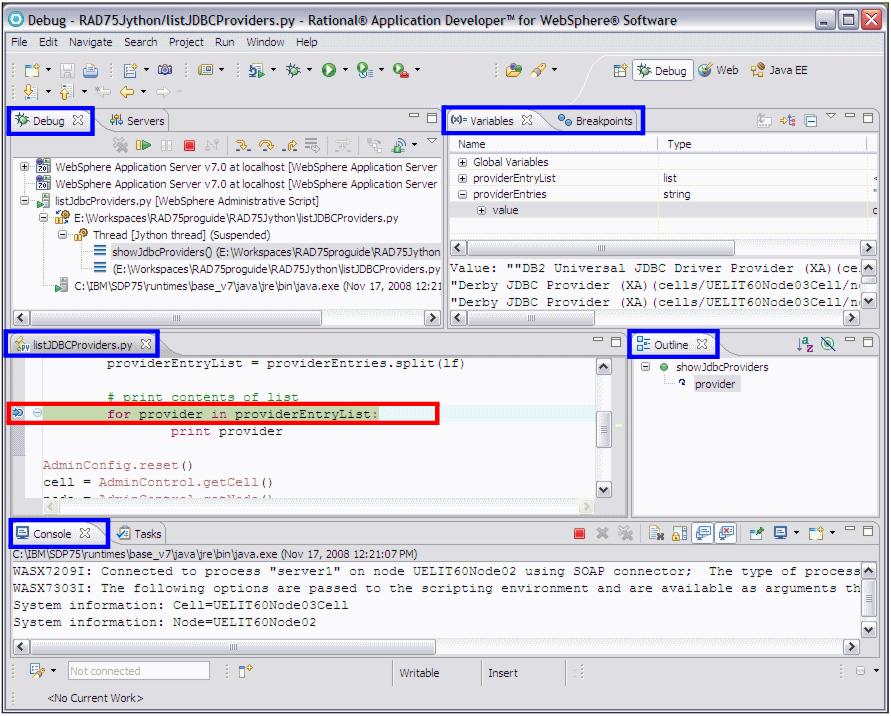
Figure 24-19 Debug perspective when debugging a Jython script
|
| Step through the Jython code and watch the variables.
|
The Jython debugger is very useful when you encounter errors in your Jython scripts. Run the script in debug mode, without having to restart the server.