Generating test reports
Based on a test execution results file, you can generate different kinds of analysis reports:

| HTTP Page Response Time report: Bar graph showing the seconds required to process each page in the test and the average response time for all pages.
|
|
| HTTP Page Hit Rate report: Bar graph showing the hits per second to each page and the total hit rate for all pages.
|
You can also generate the Test Pass report in the same way as for the basic JUnit tests.
|
Note: To view the reports, you have to install the Scalable Vector Graphics (SVG) browser plug-in.
|
HTTP Page Response Time report
To generate an HTTP Page Response Time report, do these steps:
|
| Right-click the RAD75JUnitWebTest test suite  in the Test Navigator view and select Report. in the Test Navigator view and select Report.
|
|
| In the New Report dialog, select HTTP Page Response Time and click Next.
|
|
| In the New Report dialog, accept the parent folder (RAD75JUnitWebTest), enter RAD75JUnitWebTest_HTTPPageResponseTime in the name field, and click Finish.
|
|
| If you have multiple test execution results, in the HTTP Report Generator dialog, you have to select the test execution result for which the report is generated and click Finish.
|
|
| An HTTP Page Response Time report is generated and opens in the browser, or select the generated file and Open With Ć Web Browser (Figure | 3-18).
|
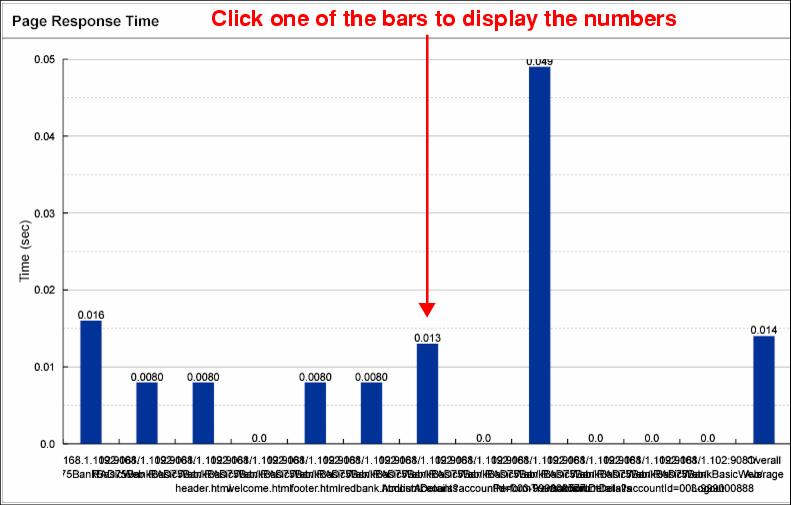
Figure 23-18 HTTP Page Response Time report
HTTP Page Hit Rate report
To generate a HTTP Page Hit Rate report, do these steps:
|
| Right-click the RAD75JUnitWebTest test suite  in the Test Navigator view and select Report. in the Test Navigator view and select Report.
|
|
| In the New Report dialog, select HTTP Page Hit Rate and click Next.
|
|
| In the New Report dialog, accept the parent folder (RAD75JUnitWebTest), enter RAD75JUnitWebTest_HTTPPageHitRate in the name field, and click Finish.
|
|
| If you have multiple test execution results, in the HTTP Report Generator dialog, you have to select the test execution result for which the report is generated and click Finish.
|
|
| An HTTP Page Hit Rate report is generated and opens in the browser, or select the generated file and Open With Ć Web Browser (Figure | 3-19).
|
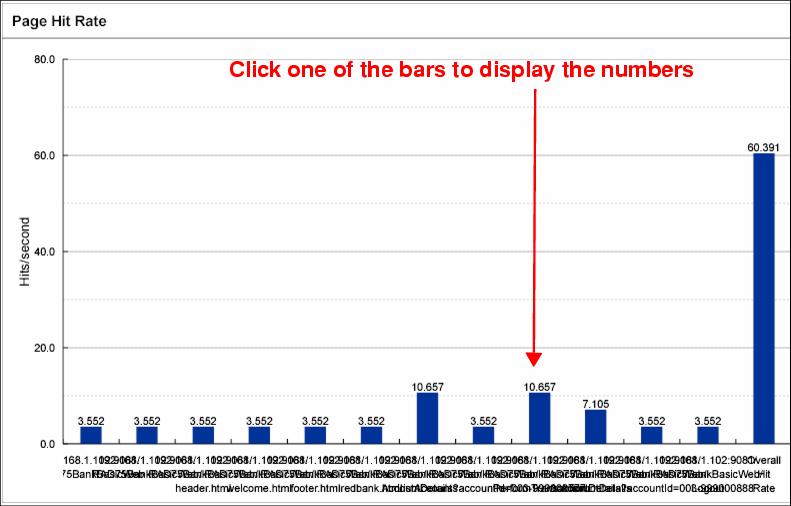
Figure 23-19 HTTP Page Hit Rate report