Use the Reporting Interface
Describes the reporting interface for IBM® DB2® Web Query for System i™, which you can use to select a domain, use items (reports, graphs, URLs) in the Domain Tree, search domains, access reporting tools such as Power Painter, Report Assistant, and Graph Assistant, and much more.
When you enter the reporting interface you are automatically connected to IBM DB2 Web Query for System i.
From the reporting interface, you can:
- Select a domain.
- Use the items (reports, graphs, or URLs) in the Domain Tree.
- Access reporting tools such as Power Painter, Report Assistant, and Graph Assistant.
The browser Back and Forward buttons cannot be used to navigate between pages in the interface, or from an interface page to a page viewed before connecting to the interface.
Parent topic:
IBM DB2 Web Query for System i Overview
Opening the Reporting Interface
Before you can access the IBM DB2 Web Query for System i environment, log on to the reporting interface.
Log On to the Reporting Interface
- From the Login page of the reporting interface,
click Login or enter the following URL in your Web browser.
http://hostname:[port]/webquery
where:
- hostname:[port]
-
Is the host name and optional port number (specified only if you are not using the default port number) where the application is deployed.
- Enter a valid i5 user ID and password.
- Click Submit. The reporting interface opens.
Recommended Browser Setup
The following browser setup is recommended for use with the interface:
- Do not cache page content.
- Disable pop-ups for reporting environment.
For information on browser setting options, see the browser Help system.
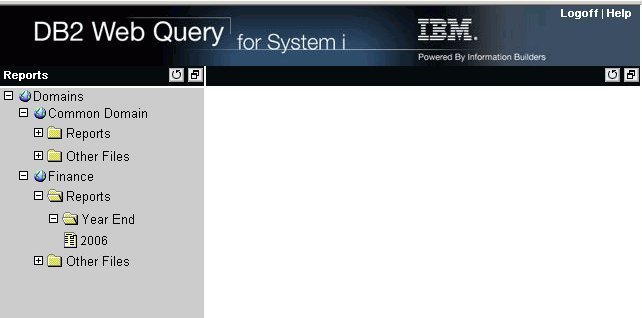
Reporting Interface Layout
The reporting interface contains the following areas:
-
Domain Tree. Contains the list of reports that you can access. You can expand the Domain Tree to view the entire name of an item by dragging the control bar that separates the Domain Tree from the content area.
- Content area. Contains content when reports are displayed.
In the following image of the interface, the:
Selecting a Domain
All of the domains that a user is authorized to access are displayed in the Domain Tree. Depending on how your user profile is set up, you may not have access to all domains.
The icon located next to an item in the Domain Tree represents the type of item. In the following table, the first column lists the icon, and the second column describes what the icon represents.
|
Icon |
Identifies... |
|---|---|
|
|
Highest level of the report organization containing folders and reports you can access. |
|
|
Location of created reports. |
|
|
Reports in a folder. |
|
|
Web pages and reports run from launch pages. |
 - Reports
 - Internet Links
Using Domain Tree Items
A domain can contain reports, which are located in the Reports folders.
When you select an item from one of the Reports folders, a menu appears; it allows you to select one of the available options. The option(s) for Reports (identified by the Report icon) include Run, Power Painter, Report Assistant, Graph Assistant, Delete, and Properties.
When you use the Delete option to delete a report, the Domain Tree refreshes and collapses. If the report is the only item in the folder, the folder is also deleted when you delete the report. You also have the option of deleting a folder including all of its contents.
- If you are running very large reports, you may need to increase the virtual memory on your machine. See your System Administrator for details.
- A menu does not appear if you are not an Administrator or a Developer.
Loading Domain Tree Folders
When a user opens one of the default folders in the Domain Tree, a request is sent to retrieve subfolders directly under the top level folder. As each node of the tree is expanded, only that section of the tree is populated. This reduces the time needed to create the tree when a Domain is selected.
When reports from a folder are loaded into the Domain Tree, only a maximum of 25 report items are loaded each time. A link labeled View More is displayed in the tree to enable users to retrieve up to an additional 25 items.
Creating Reports
In addition, you can create new reports from scratch in the Reports folder. You can create your own reports using Report Assistant, Graph Assistant, or Power Painter (if you have the required privilege). Depending on which tool you use to create your report, you can edit your report using the same tool (Power Painter, Report Assistant, or Graph Assistant). You can change the name of your report from the Properties window.
You may not be able to create reports if you do not have the privileges to do so.
Create a Report in the Interface
- In the Domain Tree, expand the Reports folder.
- Right-click a subfolder and select Power Painter, Report Assistant, or Graph Assistant.
- Create and save your report. The report is saved in the Reports folder with the name you provide.
Text Editor
Administrators and Developers only can use the text editor to troubleshoot source code for reports in the reporting interface.
The following table describes all of the functions available in the text editor. The first column lists the buttons, and the second column lists the actions they produce.
|
Button |
Action... |
|---|---|
|
|
Saves the report. Only appears if the Text Editor is opened from the Reports subfolder. |
|
|
Saves the report in the Reports folder with a name you specify. |
|
|
Runs the current report. |
|
|
Exits the Editor window. If you made changes to the original report, a window prompts you to save or cancel the changes. |
|
|
Opens the online help. |
|
|
Cut, copy, or paste, respectively, the highlighted text. |
|
|
Delete, select all, undo, and redo, respectively. |
|
|
Find and replace text. |
|
|
Enables you to go to a particular line number in the report. |
|
|
Converts highlighted text to uppercase. |
|
|
Converts highlighted text to lowercase. |
|
|
Sets the text color in the editor. |
|
|
Sets the background color of the editor.
The text color and background colors are for the current session only. |
|
|
Enables you to change the font of the editor. |
|
|
Enables you to change the font size of the text in the editor. |
 - Save button
 - Save As button
 - Run button
 - Quit button
 - Help button
 - Cut, Copy and Paste buttons
 - Delete, Select All, Undo, and Redo buttons
 - Find and Replace button
 - Go to line button
 - Uppercase button
 - Lowercase button
 - Text color button
 - Background color button
 - Font drop-down menu
 - Font size drop-down menu
- If you create a report using the Power Painter, Report Assistant, or Graph Assistant,
and then edit for troubleshooting with the text editor, you can only open and edit the report using the text editor.
- If you use a Firefox browser, the editing toolbar, which begins with the cut,
copy, paste features listed in the table, does not appear. Use the standard control keys (Ctrl+X, Ctrl+C, Ctrl+V) to cut, copy, and paste.
- When you click the X in the upper right corner of the text editor, the procedure is saved, however the Domain Tree does not refresh. To refresh the Domain Tree contents, click the refresh button (circle with arrow) in the control bar.
Using Banner Hyperlinks
The hyperlinks in the banner provide a way to easily navigate the reporting interface: