WebSphere Batch
Batch applications are designed to execute long and complex transaction processing that typically executes computationally intensive work. This type of processing requires more resources than traditional online transactional processing (OLTP) systems. Batch applications run as background jobs described by a job control language and use a processing model based on submit, work, and result actions. The execution of batch processes can take hours and the tasks are typically transactional, involving multi-step processes.
WAS V8.5 with WebSphere Batch supplies a unified batch architecture. Using XML job control language (xJCL), WebSphere Batch provides consistent programming and operational models. WebSphere Batch makes use of a batch technology optimized for Java and supports long-running applications. Ensuring agility, scalability, and cost efficiency for enterprises.
Batch jobs
A batch job consists of a series of definitions that direct the execution of one or more batch applications and specifies their input and output. A batch job performs a specific set of tasks in a predefined sequence to accomplish specific business functionalities.
Batch job workloads are executed in a batch container in WAS environments. This batch container is the main engine responsible for the execution of batch applications. It runs batch jobs under the control of an asynchronous bean, which can be thought of as a container-managed thread. The batch container ultimately processes job definitions and carries out the lifecycle of jobs.
WebSphere runs batch applications that are written in Java and implements a WebSphere batch programming model. They are packed as EAR files and are deployed to the batch container hosted in an application server or cluster. Batch applications are executed non-interactively in the background.
Batch applications implement one of two programming models:
| Transactional batch | These applications handle large amounts of work based on repetitive tasks, such as processing a large number of records. |
| Compute-intensive applications | Compute-intensive applications perform work that requires large amounts of system resources, in particular CPU and memory. The application is responsible for providing all of the logic for performing the necessary work. |
Batch jobs can perform a series of tasks that are a combination of transactional and compute-intensive tasks to complete the execution of a batch application.
Batch applications
Batch applications are programs designed to execute non-interactive tasks in the background. Input and output is generally accessed as logical constructs by the batch application and are mapped to concrete data resources by the batch job definition.
Batch applications are Java EE applications consisting of Plain Old Java Objects (POJOs).
These applications conform to a few well-defined interfaces that allow the batch runtime to manage the start of batch jobs designed for the application.
Batch work is expressed as jobs, which are made up of steps that are processed sequentially.
All jobs contain the following information:
- The identity of the batch application that performs the work
- One or more job steps that must be performed to complete work
- The identity of an artifact within the application that provides the logic for each job step
- Key and value pairs for each job step that provide additional context to the application artifacts
Jobs for batch applications contain additional information specific to the batch programming mode:
- Definitions of sources and destinations of data
- Definitions of checkpoint algorithms
Elements of the batch environment
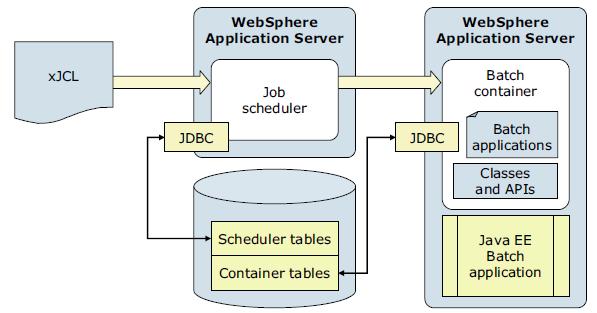
A typical batch environment consists of a job scheduler, batch container, batch applications, jobs, interfaces for management functions, and database tables
The following list describes the elements of a batch environment:
- Job scheduler
The job scheduler is the batch component hosted in an application server or in an application server cluster. It provides all job management functions, such as submit, cancel, and restart. It also maintains a history of all jobs, including those waiting to run, those running, and those having already run. It accepts and schedules the execution of batch jobs, manages the job database, assigns job IDs, and selects jobs to run.
The job scheduler exposes three API types to access its management functions:
- A web interface called the job management console
The job management console provides a graphical user interface (GUI) with which batch administrators and submitters can perform job management functions that include submitting a job, viewing jobs, canceling or suspending a job, and resuming a suspended job.
- A shell command called lrcmd
With the command-line interface, we can submit and control the batch jobs in the system.
- APIs, available as either web services or EJBs.
High availability: Each cell holds exactly one job scheduler. We can eliminate a single point of failure for the job scheduler by enabling it in an application server cluster within the cell.
- A web interface called the job management console
- Batch container
The batch container processes job definitions and carries out the lifecycle of a job. It provides the execution environment for batch jobs, under the control of asynchronous beans, similar to container-managed threads and provides application services, such as checkpoint or restart and job-logging. Java EE-based batch applications run inside the batch container, which is hosted in an application server.
The batch container is hosted in an application server or cluster. A cell can include multiple batch containers.
The batch container provides the support to run jobs with transactions and the ability to checkpoint and restart these applications, as required. For that reason, the batch container uses a relational database to store checkpoint information for transactional batch applications.
- Java EE batch application
Java EE batch applications are regular Java EE applications deployed as EAR file, which contain implementations of one or more Java batch applications. These Java batch applications follow either the transactional batch or compute-intensive programming models.
- xJCL
Jobs are described using an XML dialect called XML Job Control Language (xJCL). This dialect has constructs for expressing all of the information needed for both compute-intensive and batch jobs, although some elements of xJCL are only applicable to compute-intensive or batch jobs. The job description identifies which application to run and its input and output.
The xJCL definition of a job is not part of the batch application. This definition is constructed separately and submitted to the job scheduler to run. The job scheduler uses information in the xJCL to determine where and when the job runs.
- Scheduler tables
The job scheduler uses a relational database to store job information. It can be any relational database supported by WAS. If the job scheduler is clustered, the database must be a network database, such as DB2.
- Container tables
The batch container uses a relational database to store checkpoint information for transactional batch applications. The database can be any relational database supported by WAS and is accessed using JDBC. If the batch container is clustered, the database must be a network database, such as DB2.
- Grid endpoints
The grid endpoints are application servers that are augmented to provide a special runtime environment needed by batch applications. This runtime environment is provided by a product-provided Java EE application, the batch execution environment. This application is deployed automatically by the system when a batch application is installed, and it serves as an interface between the job scheduler and batch applications. It provides the runtime environment for both compute-intensive and transactional batch applications.
Batch programming models
The transactional batch and compute-intensive programming models are both implemented as Java objects. They are packaged into an EAR file for deployment into the application server environment. The individual programming models provide details about how the lifecycle of the application and jobs submitted to it are managed by the grid endpoints. Central to all batch applications is the concept of a job to represent an individual unit of work to be run.
We can mix transactional batch, compute intensive, and native execution job steps. The run time uses a controller the same for every job, regardless of the type of steps the job contains. The controller runs the appropriate logic for the step. These different job step types can also be run in parallel.
More information: WebSphere Batch programming models, see chapter 6 in WAS V8.5 Concepts, Planning, and Design Guide, SG24-8022.
Transactional batch programming model
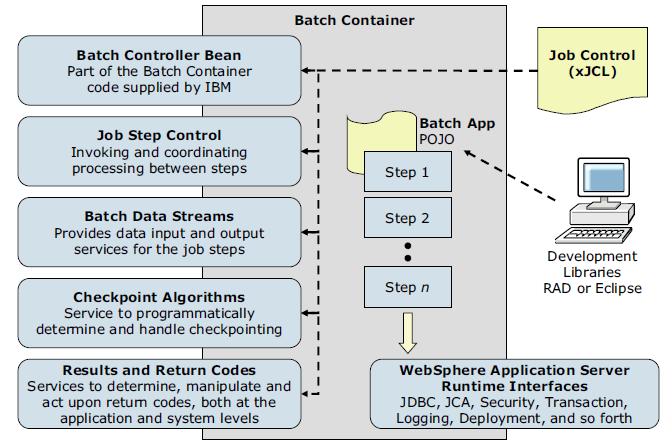
Batch applications are EJB based Java EE applications. These applications conform to a few well-defined interfaces that allow the batch runtime environment to manage the start of batch jobs destined for the application.- Batch controller bean
A batch application includes a stateless session bean the product run time provides. This stateless session bean acts as a job step controller and each application can include only a single controller bean.
The implementation of this bean is provided by the WAS product and not by the batch application. The bean must be declared in the batch application deployment descriptor. The resource references and EJB references declared on the controller bean are available to batch data streams of the batch application in which the controller bean is declared. For example, if a batch data stream in the application needs access to a data source, a resource reference to that data source can be declared on the controller bean, and the batch data stream can look up the data source at run time.
Information: batch controller bean
- Batch job steps
A batch job can be composed of one or more batch steps. All steps in a job are processed sequentially. Dividing a batch application into steps allows for separation of distinct tasks in a batch application. Batch steps are implemented as POJO classes that implement the interface com.ibm.websphere.batch.BatchJobStepInterfance. This interface provides the business logic of the batch step. Typically, a batch step contains code to read a record from a batch data stream, perform business logic with that record, and then continue to read the next record. The processJobStep method of a batch step class is called by the grid endpoints in a batch loop. This method contains all of the logic that can be batched to perform on data.
The grid endpoints invoke batch step class methods in a global transaction. This global transaction is managed by the grid endpoints. The behavior of the transaction, such as transaction timeout or transaction commit interval, is controlled by the checkpoint algorithm associated with the batch job to which the step belongs.
Information: batch job steps
- Batch data streams
Methods on the BatchDataStream interface allow the batch runtime environment to manage the data stream being used by a batch step. For example, one of the methods retrieves current cursor information from the stream to track how much data was processed by the batch step.
Batch data streams (BDS) are Java objects that provide an abstraction for the data stream processed by a batch step. A batch step can have one or more BDS objects associated with it. The grid endpoints make the BDS associated with the batch step available at run time. The grid endpoints also manage the lifecycle of a BDS by invoking batch-specific callbacks.
A BDS object implements the com.ibm.websphere.batch.BatchDataStream interface. This interface is server agnostic. The implementing object can retrieve data from any type of data source, for example, files and databases. Call back methods on the BatchDataStream interface allow the grid endpoints to manage the BDS at run time. One of the key features of a BDS is its capability to convey its current position in the stream to the grid endpoints and the capability to move itself to a given location in the data stream.
This feature allows the grid endpoints to record (in the grid endpoints database) how much data a batch step processed. This information is recorded on every checkpoint. Therefore, the grid endpoints can restart a batch job from a recorded position in the data stream if the job is canceled or fails in a recoverable manner.
Information: Batch data streams
- Checkpoint algorithms
The batch runtime environment uses checkpoint algorithms to decide how often to commit global transactions under which batch steps are started. The xJCL definition of a batch job defines the checkpoint algorithms to be used and the properties that define the checkpoint behavior, such as transaction timeouts and checkpoint intervals. We can apply a different algorithm to each batch step but can apply no more than one checkpoint algorithm to a batch step.
On each batch step iteration, the common batch container consults the checkpoint algorithm applied to that step to determine if it must commit the global transaction. Call back methods on the checkpoint algorithms allow the common batch container to inform the algorithm when a global transaction is committed or started. This behavior enables the algorithm to track the global transaction lifecycle.
WAS V8.5 supports two checkpoint algorithms:
- Results algorithm
Results algorithms are an optional feature of the batch programming model. Results algorithms are applied to batch steps through xJCL. The algorithms manipulate the return codes of batch jobs. Additionally, these algorithms are place holders for triggers based on step return codes. Results algorithms allows for two types of actions to occur at the end of a batch step:
- To influence the return code of the batch job based on the return code of the batch step that just ended. There are two types of return codes: The return code of an individual batch step and the return code of the batch job to which the step belongs.
- To provide a place holder for triggers or actions to take based on various step return codes.
At the end of a batch step, the grid endpoints check the xJCL of the batch job to determine which results algorithm to invoke. For each results algorithm specified, the grid endpoints pass to the algorithm the return code of the batch step. The results algorithm can then act based on the return codes passed in. The algorithm then passes a return code for the batch job back to the grid endpoints, which is persisted to the grid endpoints database as the current return code of the batch job. This return code can be the same as the return code the grid endpoints passed to the results algorithm initially, or the return code can be different, depending on logic coded into the results algorithm. If a results algorithm is not specified on a batch step, the job return code is that of the results algorithm from the previous step. If no results algorithms are specified, the job return code is zero (0).
- Batch job return codes
Batch job return codes fall into two groups, system and user. System return codes are defined as negative integers. User application return codes are defined as positive integers. Both system and user ranges include the return code of zero (0). If a user application return code is specified in the system return code range, a warning message is posted in the job and system logs.
Return code Explanation
0 Job ended normally
-1 Internal protocol error - WSGrid utility -2 Input parameter error - WSGrid utility -4 Job was suspended
-8 Job was canceled
-10 Job was forcibly canceled (z/OS only)
-12 Job failed and is in restartable state -14 Job failed and is in execution failed state -16 Catastrophic failure - WSGrid utility
There are two options used to report an error in a batch application. The first option is for the application to produce an exception when an error is encountered. This results in termination of the job with a batch job return code of -12 and a batch job status of restartable. The second option is for the application to return a BatchConstants.STEP_COMPLETE_EXECUTION_FAILED return code from the processJobStep method and return an application-specific error return code from the destroyJobStep method. This results in termination of the job and a batch job status of execution failed.
- xJCL
The WebSphere Batch uses xJCL to describe jobs that identify the batch application to run. The xJCL language definition is similar to traditional JCL, and it has constructs for expressing all of the information needed for both compute-intensive and batch jobs. The xJCL definition of a job is not part of the batch application.
The job definition identifies which batch application to run and its inputs and outputs. It also identifies which checkpoint algorithms and results algorithms to use. The job scheduler uses information in the xJCL to determine where and when the job runs.
<job name="PostingsSampleEar"
     xmlns:xsi="http://www.w3.org/2001/XMLSchema-instance">

<jndi-name>ejb/com/ibm/websphere/samples/PostingsJob</jndi-name>

<step-scheduling-criteria>
    <scheduling-mode>sequential</scheduling-mode>
</step-scheduling-criteria>
<checkpoint-algorithm name="${checkpoint}">

    <classname>com.ibm.wsspi.batch.checkpointalgorithms.${checkpoint}</classname>
    <props>
        <prop name="interval" value="${checkpointInterval}" />
    </props>

</checkpoint-algorithm>
<results-algorithms>
    <results-algorithm name="jobsum">
        <classname>com.ibm.wsspi.batch.resultsalgorithms.jobsum</classname>
    </results-algorithm>
</results-algorithms>

<substitution-props>
    <prop name="wsbatch.count" value="5" />
    <prop name="checkpoint" value="timebased" />
    <prop name="checkpointInterval" value="15" />
    <prop name="postingsDataStream"
          value="${was.install.root}${file.separator}temp${file.separator}postings" />
</substitution-props>

<job-step name="Step1">
    <jndi-name>ejb/DataCreationBean</jndi-name>
    <checkpoint-algorithm-ref name="${checkpoint}" />
    <results-ref name="jobsum"/>
    <batch-data-streams>
        <bds>
            <logical-name>myoutput</logical-name>
            <impl-class>com.ibm.websphere.samples.PostingOutputStream</impl-class>
            <props>
            <prop name="FILENAME" value="${postingsDataStream}" />
            </props>
        </bds>
    </batch-data-streams>
    <props>
        <prop name="wsbatch.count" value="${wsbatch.count}" />
    </props>
</job-step>

<job-step name="Step2">
    <step-scheduling condition="OR">
        <returncode-expression step="Step1" operator="eq" value="0" />
        <returncode-expression step="Step1" operator="eq" value="4" />
    </step-scheduling>
    <jndi-name>ejb/PostingAccountData</jndi-name>
    <checkpoint-algorithm-ref name="${checkpoint}" />
    <results-ref name="jobsum"/>
    <batch-data-streams>
    <bds>
        <logical-name>myinput</logical-name>
        <impl-class>com.ibm.websphere.samples.PostingStream</impl-class>
        <props>
            <prop name="FILENAME" value="${postingsDataStream}" />
        </props>
        </bds>
    </batch-data-streams>
</job-step>

<job-step name="Step3">
    <step-scheduling>
        <returncode-expression step="Step2" operator="eq" value="4" />
    </step-scheduling>
    <jndi-name>ejb/OverdraftAccountPosting</jndi-name>
    <checkpoint-algorithm-ref name="${checkpoint}" />
    <results-ref name="jobsum" />
    <batch-data-streams>
        <bds>
            <logical-name>dbread</logical-name>
            <impl-class>com.ibm.websphere.samples.OverdraftInputStream</impl-class>
        </bds>
    </batch-data-streams>
</job-step>
</job>
Compute-intensive programming model
Compute-intensive applications are applications that perform intensive computational work that does not fit into the conventional Java EE request and response paradigm due to the following characteristics:
- The need for asynchronous submission and start of work
- The need for work to run for extended periods of time
- The need for individual units of work to be visible to and manageable by operators and administrators
The compute-intensive programming model provides an environment that addresses these needs, centered around two basic concepts:
- The use of jobs to submit and manage work asynchronously
- A minor extension to the asynchronous beans programming model to support work that runs for an extended period
A compute-intensive application is packaged in an enterprise bean module in a Java EE EAR file. The deployment descriptor for the enterprise bean module must contain the definition of the controller bean. The implementation of the controller bean is provided in the application server runtime. The controller bean allows the runtime environment to control jobs for the application. When a job arrives for the application to run, the compute-intensive execution environment invokes the controller bean. The JNDI name of this stateless session bean is specified in the xJCL for the job.
A compute-intensive application is started by the application server in the same way as other Java EE applications are started. If the application defines any start-up beans, those beans are run when the application server starts.
We can use Java EE development tools, such as Rational Application Developer, to develop and package compute-intensive applications in the same way they are used to construct Java EE applications containing enterprise bean modules and asynchronous beans.
Parallel batch
A transactional batch application can be built as a job and divided into subordinate jobs so the subordinate jobs can run independently and in parallel. Use parallel job manager to submit and manage the transactional batch jobs.
The parallel job manager (PJM) provides a facility and framework for submitting and managing transactional batch jobs that run as a coordinated collection of independent parallel subordinate jobs. The PJM basic features are:
- The PJM is in the batch container. We do not need to install and configure the PJM.
- Only a single xJCL file is required. The file combines the contents of the top-level job xJCL with the contents of the subordinate job xJCLs.
- We do not need to create a separate database.
- You package the PJM APIs in the batch application as a utility JAR. No shared library is required.
- The contents of the xd.spi.properties file are part of the xJCL.
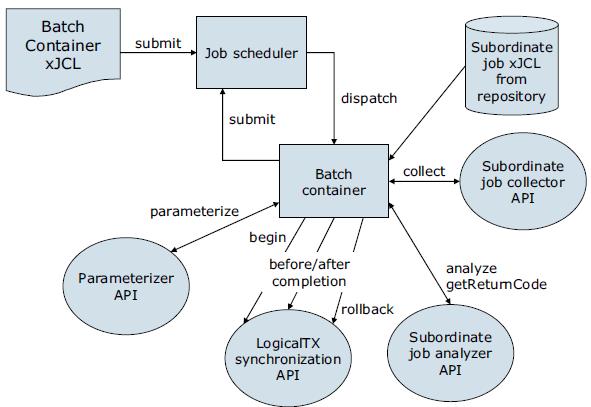
With PJM job management, the top-level job submits the subordinate jobs and monitors their completion. The top-level job end state is influenced by the outcome of the subordinate jobs, as follows:
- If all subordinate jobs complete in the ended state, , in a successful completion, the top-level job completes in the ended state.
- If any subordinate job completes in the restartable state and no subordinate job ended in the failed state, the top-level job completes in the restartable state.
- If any subordinate job completes in the failed state, the top-level job completes in the failed state.
- If the top-level job and subordinate jobs are in the restartable state, restart only the top-level job. If any subordinate jobs are restarted manually, the top-level job does not process the logical transaction properly.
The steps in the execution of parallel batch jobs can be executed in different application server instances that are part of the same cluster. The steps are:
- First, the xJCL is submitted to the job scheduler, which dispatches the xJCL to an endpoint that runs the application the xJCL references.
- The batch container determines the job is to have subordinate jobs running in parallel from inspecting the run property of the job in the xJCL and then delegates the running to the PJM subcomponent.
- The PJM invokes the parameterizer API and uses the information in the xJCL to help divide the job into subordinate jobs. The PJM then invokes the LogicalTX synchronization API to indicate the beginning of the logical transaction. The PJM generates the subordinate job xJCL and submits the subordinate jobs to the job scheduler.
- The job scheduler dispatches the subordinate jobs to the batch container endpoints so they can run.
- The batch container runs the subordinate job. When a checkpoint is taken, the subordinate job collector API is invoked.
- This API collects relevant state information about the subordinate job. This data is sent to the subordinate job analyzer API for interpretation.
- After all subordinate jobs reach a final state, the beforeCompletion and afterCompletion synchronization APIs are invoked. The analyzer API is also invoked to calculate the return code of the job.
Other aspects to be taken into account to help understand how to optimally use the parallel job manager are:
- Transaction timeouts
We can keep the default value for the TransactionTimeOut property in the top-level job xJCL. We can alternatively adjust it depending on the transaction timeout of the subordinate job.
- Job logs
We can view job logs for a subordinate job from the job management console. The PJM retrieves subordinate job logs for its logical job and aggregates them into its top-level job log.
- Disaster recovery
We can use the job recovery script when a primary site fails to allow a secondary site to take over.
COBOL support
COBOL has been a part of batch processing since the early days of computers and there is significant investment in mission-critical COBOL assets, especially on mainframes. With WAS V8.5, COBOL support includes the following key features:- In z/OS, we can call standard COBOL modules from Java on the same thread in same process.
- Java and COBOL run in same transaction scope.
- WebSphere-managed DB2 connections are shareable with COBOL.
- We can use COBOL working storage isolation per job step or per remote call.
- IBM Rational Application Developer tooling is available for Java call stub generation.
The new COBOL container allows COBOL modules to be loaded into the WAS for z/OS address space and invoked directly. It provides the means of direct integration of COBOL resources into WebSphere Java processing. The container itself is implemented as a handful of DLLs and JAR files
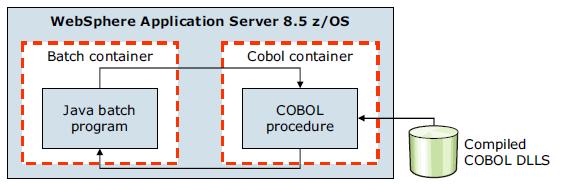
The COBOL container enables COBOL modules to be loaded into the batch container where they are invoked directly by the batch application. The COBOL container itself can be created and destroyed multiple times within the lifecycle of a server. Each container is created with Language Environment enclave separate from that of a server. The container is assured of a clean Language Environment each time it is created.
Java programs can pass parameters into COBOL and retrieve the results. The COBOL call stub generator tool is provided to create the Java call stubs and data bindings based on the data and linkage definitions in the COBOL source.
We can dynamically update a COBOL module without having to restart the application server. Further, JDBC Type 2 connections created by the Java program can be shared with the COBOL program under the same transactional context. The COBOL container supports a wide variety of data types beyond integers, including primitive and national data types.
Information: COBOL support on WAS V8.5 Batch
More information is also in section 6.5.3 COBOL support in WAS V8.5 Concepts, Planning, and Design Guide, SG24-8022.
Batch toolkit
IBM provides two features to help with the development of batch applications:
- Rational Application Developer includes a complete set of tools to facilitate batch application development
- The batch toolkit supplied with WAS includes tools to facilitate batch application development. It combines batch development tools into a ready-to-use environment and includes simple command-line utilities that deal with packaging applications and other tasks. However, it does not include the full utilities that come with Rational Application Developer.
The batch toolkit contains the following components:
- Batch framework
- Lightweight batch container
- Packaging tool
- xJCL generator
- Unit test server
Configuring the batch environment
Configuration tasks for the batch environment include configuring the job scheduler and grid endpoints.
To set up an environment to host transactional batch or compute-intensive job types, you must deploy the job scheduler and the batch container to at least one WebSphere application server or cluster. The transactional batch, compute-intensive applications, or both are installed on the same WebSphere application server or cluster.
The job scheduler and batch container both require access to a relational database. Access to the relational database is through the underlying WAS connection management facilities. The relational databases supported are the same as those relational databases that are supported by WAS, including DB2, Oracle, and others. The simple file-based Apache Derby database is automatically configured for you by default so that we can quickly get a functioning environment up and running. However, do not use the Derby database for production use. Moreover, the default Derby database does not support a clustered job scheduler, nor a clustered batch container.
A highly-available environment includes both a clustered job scheduler and one or more clustered batch containers. Clustering requires a network database. Use production grade databases, such as DB2 for this purpose.
Configure the job scheduler
The job scheduler accepts job submissions and determines where to run them. As part of managing jobs, the job scheduler stores job information in an external job database.
Configuration for the job scheduler includes the selection of the deployment target, data source JNDI name, database schema name, and endpoint job log location to be configured for the scheduler.
We can use the command-line interface, the EJB interface, the web services interface, and the job management console to communicate with the job scheduler.
Stand-alone application servers or clusters can host the job scheduler. The first time a server or cluster is selected to host the grid scheduler, an embedded Apache Derby database is automatically created and configured to serve as the scheduler database if the default data source JNDI name jdbc/lrsched is selected.
Although Derby is used as the default job scheduler database, you might want to use our own database.
Secure the job scheduler
WebSphere authentication determines the users, from the active WebSphere security registry, that can authenticate and gain access to the web, command line, and programmatic interfaces of the job scheduler. Therefore, we can secure the job scheduler application by simply enabling global security and application security.Application security secures the job management console. The job scheduler application uses a combination of both declarative and instance-based security approaches to secure jobs and commands.
Finally, security for the batch environment is based on two basic principles of WebSphere security:
- Authentication
Allows users defined to the WebSphere active security repository to authenticate and gain access to the web, command line, and programmatic interfaces of the job scheduler.
- Authorization
Using roles assignment, WebSphere determines if the authenticated users have the proper security rights to perform actions against jobs. There are three roles:
- lrsubmitter: Users in the lrsubmitter role can view, submit, and operate on their own jobs, but on no others.
- lradmin: Users assigned the lradmin role have authority to perform all job scheduler application actions on all jobs regardless of job ownership.
- lrmonitor: Users assigned the lrmonitor role only can view jobs and job logs of all users.
The actions that a user can take against a job depend on the security model being enforced. User actions against a job can be role based, group based, or a combination of the two.
- Role based security
When role-based security is enabled, be granted the lrsubmitter role, the lradmin role, or the lrmonitor role to act on a job.
- Job group security
In the group security model, group-affiliation alone is the basis for all job-related security decisions. The administrator does not assign job roles to specific users. A user can complete an action for a job only if the user and job are members of the same group. For example, if two users are members of the same group and each submits a job assigned to that same group, both users can view and take actions against either of the two jobs.
- Job group and role security
In the group and role security model, both group-affiliation and role-based security governs job-related security decisions. This means a user can take a job-related action only if the user and job are members of the same group and the user's role permits the job action.
Job scheduler integration with external schedulers
Many customers already use an external workload scheduler to manage batch workloads on the z/OS operating system. While a Java batch running inside a WAS environment is attractive, a way to control batch jobs through an external workload scheduler is important.We can integrate the job scheduler with an external workload scheduler by configuring and securing the job scheduler, enabling the interface, and running batch jobs with the WSGrid utility.
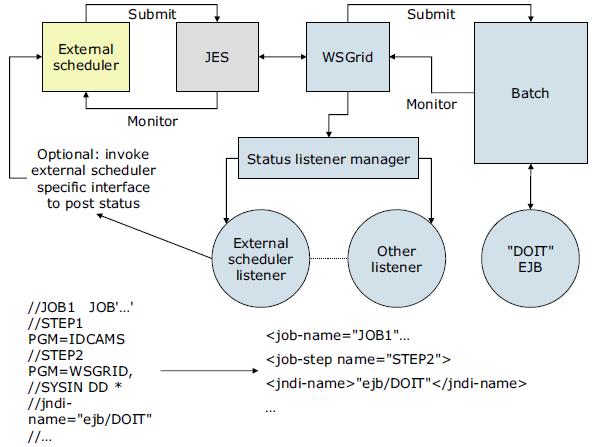
External scheduler integration
Because an external scheduler does not know how to directly manage batch jobs, a proxy model is used. The proxy model uses a regular JCL job to submit and monitor the batch job.
The JCL job step invokes a special program provided by batch, named WSGRID. The WSGRID application submits and monitors a specified batch job, writing intermediary results of the job into the JCL job log. WSGRID does not return until the underlying job is complete, consequently providing a synchronous execution model. Because the external scheduler can manage JCL jobs, it can manage a JCL job that invokes WSGRID. Using this pattern, the external scheduler can indirectly manage a job.
An optional plug-in interface in the job scheduler enables a user to add code that updates the external scheduler operation plan to reflect the unique state of the underlying job, such as job started, step started, step ended, job ended. The WSGRID program is written with special recovery processing so that if the JCL job is canceled, the underlying job is canceled also, thus ensuring synchronized lifecycle of the two jobs.

Job control by an external workload scheduler for the z/OS platform environment. In this diagram, the Tivoli Workload Scheduler is shown as an example workload scheduler, communicating with the z/OS Job Entry Subsystem (JES).
Configuring the external scheduler interface
We can configure an external scheduler interface to control the workload for batch jobs. To communicate with the external scheduler interface, we can use:
- The default messaging provider as a JMS provider.
The external scheduler interface uses JMS as its default messaging provider. JMS is a bidirectional communication mechanism between an external client and the job scheduler.
Information: Set up the external scheduler interface using the default messaging provider
- On z/OS you also have the option of setting up the external scheduler interface using WebSphere MQ as a messaging provider.
Information: Set up the external scheduler interface using the WebSphere MQ for z/OS platforms
Configure grid endpoints
To set up a WebSphere grid endpoint:
- Install a batch application on a server or cluster using the dmgr console, wsadmin commands, or another supported method for deploying applications.
- If the application is the first batch application installed on the server or cluster, restart the server or cluster.
The WebSphere grid endpoints are automatically set up. By installing the application on the deployment target, the common batch container is automatically deployed on the server or cluster selected using the default Apache Derby data source.
The default file-based Derby data source can be used only when using the batch function on a stand-alone application server. If we have a WAS ND environment, use a network database.
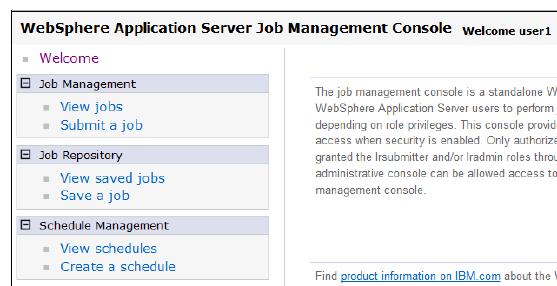
Configure the job scheduler and job management console
The job management console is a stand-alone web interface for managing jobs. It runs on a target application server or cluster within a WebSphere cell, more specifically, in the cluster or application server where the job scheduler is enabled.
With the job management console we can:
- Submit jobs
- Monitor job execution
- Perform operational actions against jobs
- View job logs
- Manage the job repository
- Manage job schedules
Some of the specific actions that we can execute through the job management console are:
- Submitting job schedules with a preferred processing time
- Configuring job schedules so they can, for example, occur or recur at a specific time of day or week
- Choosing to delay the submission of a job by specifying the start date and time of when to run the job
When role-based security is enabled, be granted the lrsubmitter role, the lradmin role, or the lrmonitor role through the dmgr console to access the job management console.
When the security enabled is based on the group and the role, be in the appropriate group and the appropriate role to access the job management console. You must be in the user group of the job or the administrative group. You must also be in the lrsubmitter role, the lradmin role, or the lrmonitor role.
To access the job scheduler from the job management console:
- Configure the job scheduler.
- Ensure the job scheduler is running.
If the application server or cluster members on which the job scheduler is installed have the started icon in the status field, the job scheduler is usually running. We can verify whether the job scheduler started by checking the log files.
- In a browser, type the web address:
-
http://<job scheduler server host>:<port>/jmc
If an on-demand router (ODR) is defined in the cell, type the web address:
-
http://<odr host>:80/jmc
- If we cannot access the job management console, check the appropriate log. If you specified a server in the web address, check the server log. If you specified a cluster member in the web address, check the cluster member log.
Command-line interface for batch jobs
The command-line interface interacts with the job scheduler to submit and manipulate a batch job. It is located in the app_server_root/bin directory as the lrcmd.sh or lrcmd.bat script and can be started from any location in the WebSphere cell.
The following examples illustrate the use of the lrcmd script on a UNIX system:
- Submit a job to the job scheduler.
-
./lrcmd.sh -cmd=submit -xJCL=myxjclfile.xml -host=myHost -port=80
- Cancel a previously submitted job.
-
./lrcmd.sh -cmd=cancel -jobid=myJob:2 -host=myHost -port=80
- Restart a job.
-
./lrcmd.sh -cmd=restart -jobid=myJob:2 -host=myHost -port=80
- Purge job information.
-
./lrcmd.sh -cmd=purge -jobid=myJob:2
- Show the status of a batch job.
-
./lrcmd.sh -cmd=status host=myHost -port=80
- Save an xJCL to the job repository.
-
./lrcmd.sh -cmd=save -xJCL=myxjclfile.xml -job=myJob -host=myHost -port=80
- Remove a job from the job repository.
-
./lrcmd.sh -cmd=remove -jobid=myJob:2 -host=myHost -port=80
- Show the status of a batch job.
-
./lrcmd.sh -cmd=status host=myHost -port=80
- Suspend a job.
-
./lrcmd.sh -cmd=suspend -jobid=myJob:2 -seconds=300 -host=myHost -port=80
- Resume start of a previously suspended job.
-
./lrcmd.sh -cmd=resume -jobid=myJob:2
- Display the output for a job.
-
./lrcmd.sh -cmd=output -jobid=myJob:2 -host=myHost -port=80
- Display the return code of a batch job.
-
./lrcmd.sh -cmd=getBatchJobRC -jobid=myJob:2 -host=myHost -port=80
- Submit a recurring job request to the job scheduler.
-
./lrcmd.sh -cmd=submitRecurringRequest -job=WeeklyJob -request=MyWeeklyReport -interval=weekly -startDate=2012-07-01 -startTime=23:00:00
- Modify an existing recurring job request.
-
./lrcmd.sh -cmd=modifyRecurringRequest -request=MyWeeklyReport -startDate=2012-07-01 -startTime=22:30:00 -xJCL=/tmp/myJulXJCL -port=80\
Information: command line interface for batch jobs
Job logs
A job log is a file containing a detailed record of the execution details of a job. System messages from the batch container and output from the job executables are collected. By examining job logs, we can see the lifecycle of a batch job, including output from the batch applications themselves.
A job log is composed of the following three types of information:
- xJCL
A job log contains a copy of the xJCL used to run the job, including xJCL substitution values.
- System messages
A set of system messages that communicate the major lifecycle events corresponding to the job. The following system events are recorded in a job log:
- Begin and end of a job
- Begin and end of a step
- Begin and end of a checkpoint
- Open, close, and checkpoint of a batch data stream
- Checkpoint algorithm invocation / results
- Results algorithm invocation / results
- Application messages
A set of messages written to standard out and standard error by a job step program. Job log output is collected on the job scheduler node and on the grid execution endpoint node. The logs are viewable through the job management console. Information for the logs is dynamically updated, so we can refresh the job log view to collect the latest information of the job log while the job is running. Example 22-2 is a sample of this type of log.
System.out: [03/13/07 08:25:32:708 EDT] Tue Mar 13 08:25:32 EDT 2007: SimpleCI application starting...
System.out: [03/13/07 08:25:32:708 EDT] ->Will loop processing a variety of math functions for approximately 30.0 seconds!
System.out: [03/13/07 08:26:02:752 EDT] Tue Mar 13 08:26:02 EDT 2007: SimpleCI application complete!
System.out: [03/13/07 08:26:02:753 EDT] ->Actual Processing time = 30.043 seconds!
CWLRB5764I: [03/13/07 08:26:03:069 EDT] Job SimpleCIEar:44 ended
Job classes
Each job is assigned to a job class, which defines policies to limit resource consumption by batch jobs. Job classes can be configured using the dmgr console.Job classes establish policies for:
- Execution time
Maximum time a job can run before being automatically canceled by the system.
- Concurrent jobs
Maximum number of concurrently dispatched jobs of a given job class.
- Job log retention
Specifies the rule for deleting aged job logs. Retention can be specified by either space or time:
Space Specified in megabytes. Job logs of the specified class are deleted from oldest to newest on an endpoint if the sum of space used by job logs exceeds the specified maximum. Time Specified as an integral number of days. Job logs of the specified class older than N days old are automatically deleted by the system. - Job output queue
Specifies the rule for deleting jobs on the job output queue. A job is on the output queue after it has either completed, stopped, or canceled. Output queue policy allows for automatic purging of the output queue by:
Number Specified as an integral number of jobs. When jobs on the output queue of the specified class exceed this number, they are deleted oldest to newest until the total is less than the specified number. Time Specified as an integral number of days. Job logs of the specified class older than N days old are automatically deleted by the system.
Example: Working with batch applications
The conditions for this scenario are:
- A stand-alone application server called itsoBatch that hosts the job scheduler and batch application.
- The WAS install path (WAS_HOME) is
-
/opt/WAS/AppServer.
- The Java Batch IVT Sample is used. The sample is stored in /tmp/sample_ivt (referred to as <unzipped_sample_dir>).
Enabling the job scheduler
After the itsoBatch application server is created, the job scheduler can be configured using the dmgr console. The following instructions provide an example of how to configure the job scheduler using the dmgr console:- Log on to the dmgr console.
- To view the Job scheduler page.
-
System administration | Job scheduler
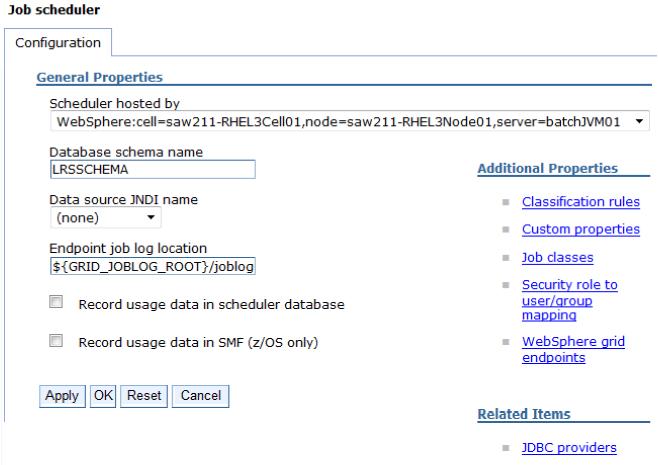
- In the Scheduler hosted by list, select the deployment target.
- Type the database schema name. The default is LRSSCHEMA.
- Select the data source JNDI name from the list. If the default of (none) is selected, a default embedded Derby job scheduler database is created with a value of jdbc/lrsched.
- Type the directory where the job scheduler and the batch execution environment write the job logs. The default is...
-
${GRID_JOBLOG_ROOT}/joblogs
- Optional: Select the record usage data in scheduler database option to specify if the scheduler records job usage data for charge-back purposes in the scheduler database.
- Click OK and save the configuration.
- If administrative security is enabled, enable application security and secure the job scheduler
Verifying the job scheduler installation
To verify the job scheduler is installed correctly:
- Restart the application server (or cluster members) where the job scheduler is configured.
If the application server (or cluster members) on which the job scheduler is installed has the started icon in the status field, the job scheduler is active. We can verify whether the job scheduler started by checking the log files.
- Access the job management console through a web browser by typing: http://job_scheduler_server_host:grid_host/jmc
The grid_host port is the WC_defaulthost port for the server running the job scheduler. To find this port, go to your server in the dmgr console, expand ports, and look for WC_defaulthost. In the case of our test environment, the URL is http://saw211-RHEL3:9080/jmc.
To ensure the job management console is working correctly, check the SystemOut.log file on the target application server configured to host job scheduler. Example 22-3 shows the message in the log the application as started.
[6/20/12 12:04:48:739 EDT] 0000006c JobSchedulerS I CWLRB3220I: Long Running Job Scheduler is initialized
Installing the sample batch application
To install the IVT sample batch application into WAS:
- Download the sample IVT application compressed file from the WAS V8.5 Information Center website.
- Unzip the file on your target server.
- Configure the JAVA_HOME and add it to the PATH environment variables in the system to be able to run java and create the IVT database on Derby.
- Run the command java -version to verify Java v1.6 or later is installed and defined in the system�s path.
- Create the IVTDB database in the server where the target application server is running.
Use the appropriate CreateIVTTables DDL file (CreateIVTTablesDerby.ddl) located in the <unzipped_sample_dir>/IVT/scripts directory of the uncompressed IVT sample application: From a command prompt, issue the following commands:
-
cd WAS_HOME/derby/databases
java -Djava.ext.dirs=WAS_HOME/derby/lib -Dij.protocol=jdbc:derby:org.apache.derby.tools.ij<unzipped_sample_dir>/scripts/CreateIVTTablesDerby.ddl - Create the JDBC resources:
- In the dmgr console, click...
-
Resources | JDBC | JDBC providers
- Create a JDBC XA provider at the server scope with the following properties:
- Database type: Derby
- Provider type: Derby JDBC Provider
- Implementation type: XA data source
- Name: XDCGIVT Derby JDBC Provider (XA)
- Description: Accept the default value
- Click through the remaining panels. On the last panel, click Finish.
- In the dmgr console, click...
-
Resources | JDBC | Data source
- Create a data source with the following properties:
- Data source name: XDCGIVT data source (XA)
- JNDI name: jdbc/IVTdbxa
- JDBC provider: XDCGIVT Derby JDBC Provider (XA)
- Database name: WAS_HOME/derby/databases/IVTDB
- Select the option Use this data source in container managed persistence (CMP).
- Security aliases: Accept the default values.
- Click through the remaining panels. On the last panel, click Finish.
- Save the configuration to the master repository and synchronize the nodes.
- In the dmgr console, click...
- Select the new data source, and click Test Connection to test the connection to the database.
- Install the XDCGIVT sample using the dmgr console:
- In the dmgr console, click...
-
Applications | New application | New Enterprise Application
- Specify the full path to the sample XDCGIVT.ear file(<unzipped_sample_dir>/installableApps/XDCGIVT.ear).
- In the wizard, select Fast Path -Prompt only when additional information is required, accept default settings, apply the proper modules mapping, and continue through the steps.
When mapping modules of the batch application to servers, select the server (or cluster) to run the batch job (itsoBatch). Click Finish when you are done. d. Restart the application server.
- In the dmgr console, click...
- After the application server is restarted, verify the application installed successfully:
- Go to the Enterprise applications dmgr console page by clicking...
-
Applications | Application Types | WebSphere enterprise applications
- If the application is not running, select the application, and click Start.
- Go to the Enterprise applications dmgr console page by clicking...
Secure the job scheduler using Job groups
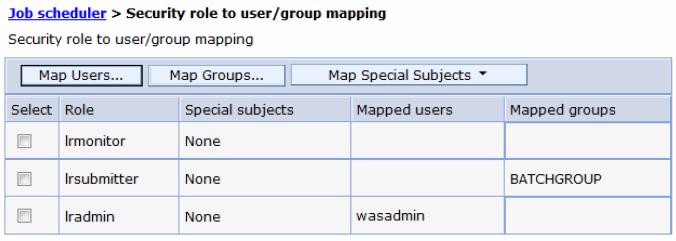
We can secure the job scheduler using groups. A user can then act on a job only if the user and job are members of the same group.
This example assumes the job scheduler is configured and that WebSphere security is enabled. It also assumes that a group was created and a user that belongs to the group. For this example, the user ID is user1 and the group is BATCHGROUP. Group security is enabled for the job scheduler by mapping authenticated users to the lradmin administrative security role. The next step is to assign a group to a job.
We can use the dmgr console to enable job group security for the job scheduler with the following procedure:
- Enable job group security for the job scheduler:
For the purpose of this scenario, we mapped the wasadmin, our primary WebSphere administrative ID to the lradmin role, and a user group, BATCHGROUP, to the lrsubmitter role. This allows you to access the job scheduler console with different roles and understand the difference of permissions and possibilities each role provides. There is also the lrmonitor role that can be used for ID and group mapping:
- Click...
-
System administration | Job scheduler | Security role to user/group mapping
- Select lradmin for the role, and click Map Users:
- In the Job scheduler | Security role to user/group mapping | Map users/groups window, click Search to list all users.
- Select your primary WebSphere administrative ID from the Available listview, which in this example is wasadmin, and click the right arrow button to add the selected user to the Selected list
- Click OK.
- Select the lrsubmitter role, and click Map Groups.
- In the Job scheduler | Security role to user/group mapping | Map users/groups window, click Search to list all groups.
- Select the BATCHGROUP from the Available listview, and click the right arrow button to add the selected user to the Selected listview.
- Click OK.
- Save the updates.
- Restart the server.
- Verify that group security is enabled. A message in the SystemOut.log file of the application server (in our case the batchJVM01 application server) indicates that group security is enabled.
CWLRB5837I: The WAS Batch Feature is running under GROUP
security policy
- Click...
Use the job management console
After the job scheduler is enabled with the proper security settings and you completed the deployment of the sample IVT batch application, we can use the job management console to perform administrative tasks for the batch job.The following URL is used to access the job management console:
-
http://saw211-RHEL3:9080/jmc
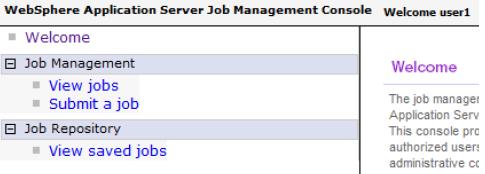
For comparison, access the job management console with the user ID that was mapped to the lradmin role, which in our case is the wasadmin ID. Note the full range of functionality available.
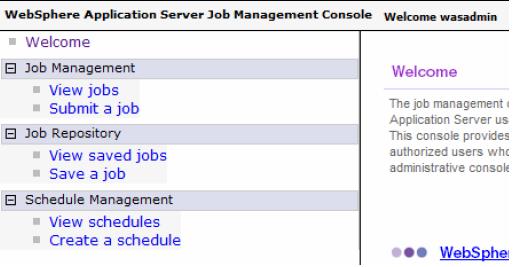
Next, access the console with the user ID mapped to the lrsubmitter role, which in this test case is user1. Note the noticeable difference between the lradmin and the lrsubmitter permissions. The user1 ID has restricted access in the console.
Submitting a job
The sample IVT application contains a few batch jog xJCL files:
- XDCGIVTtxt2txtxJCL.xml
Copies one text file to another text file and compares the two files.
- XDCGIVTbyte2bytexJCL.xml
Copies a byte file to another byte file and compares the two files.
- XDCGIVTtxt2db2txtxJCL.xml
Copies a text file to a database, copies the entries in the database to another text file, and compares the two files.
To test these batch jobs, first edit these files and set the following parameters to a valid location on your test server:
- inputDataStream, with a valid input file path:
-
<prop name="inputDataStream" value="/tmp/ivtJobs/input-text.txt" />
- outputDataStream, with a valid ouput file path...
-
<prop name="outputDataStream" value="/tmp/ivtJobs/output-text.txt" />
After you modify the files, follow this procedure to submit the XDCGIVTtxt2txtxJCL.xml job:
- Connect to the Job management console as user1 (lrsubmitter role).
- Navigate to Job Management | Submit a job.
- Under the Job Definition section, apply the following options:
- Select Local file system.
- Click Browse next to Specify path to xJCL to specify the file containing the job definition to submit as a new job:
-
<unzipped_sample_dir>/IVT/scripts/XDCGIVTtxt2txtxJCL.xml
- Select Update substitution properties to update the values of the substitution properties for the job. If a job has substitution properties without values, specify them. For the testing of this scenario, this option is disabled.
- Enable Delay submission to delay the start date and time of when to run the job.
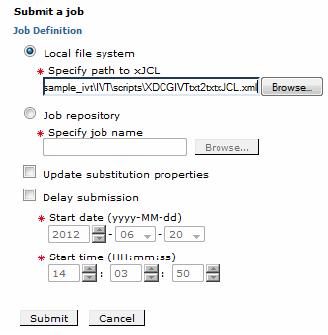
- Click Submit Saving a job
Saved batch jobs can be stored in a job repository and can be re-used when you are submitting jobs or creating job schedules.
To save a batch job using the job management console:
- Navigate to Job Repository | Save a job.
- Specify a Job name.
- Specify the xJCL path of the batch job.
- Click Save.
Creating a job schedule
The job management console allows you to create job schedules so that job processing can occur or recur on a specific time of day or week.
To create schedules:
- Navigate to Schedule Management | Create a schedule

- Specify the schedule name.
- Set the start date of the new schedule.
- Set the repetition interval for the schedule and then click Next.
- In the Specify job window, specify the local path of the xJCL file, or select a previously saved job from the job repository and then click Next.
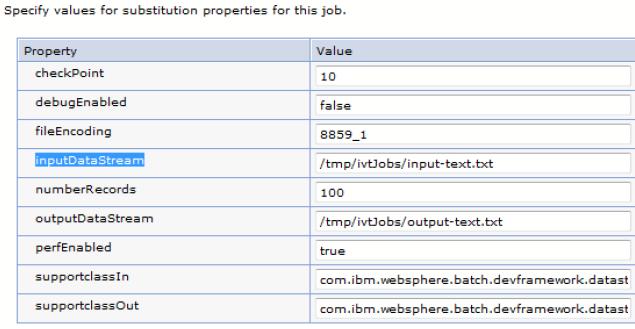
- We can specify values for substitution properties for the job. In the case of the IVT sample application,
- Review the scheduler configuration settings, and click Finish.
Use the command-line interface for batch jobs
The command-line interface interacts with the job scheduler to submit and manipulate a batch job.
Showing the status of batch jobs
To list the status of previously submitted jobs:
- Connect to the server where the job scheduler is active.
- cd WAS_HOME/bin.
- Execute the following command:
-
./lrcmd.sh -cmd=status -host=<job_scheduler_host> -port=<job_scheduler_port> -userid=<userid_job_scheduler> -password=<password_job_scheduler>
Example:
-
./lrcmd.sh -cmd=status -host=saw211-RHEL3 -port=9080 -userid=user1 -password=batch
Output from the lrcmd command for status of batch jobs
CWLRB4940I: com.ibm.ws.batch.wsbatch : -cmd=status -host=saw211-RHEL3 -port=9080 -userid=user1 -password=********
CWLRB5000I: Wed Jun 27 18:07:10 EDT 2012 : com.ibm.ws.batch.wsbatch : response to status
CWLRB3060I: [2012-06-27 15:07:16.459] [XDCGIVT:00000] [pending submit] [Batch] [user1] [] []
CWLRB3060I: [2012-06-27 17:42:50.050] [XDCGIVT:00004] [ended] [Batch] [user1] [saw211-RHEL3Node01] [itsoBatch]
CWLRB3060I: [2012-06-27 17:42:55.314] [XDCGIVT:00005] [pending submit] [Batch] [user1] [] []
CWLRB3060I: [2012-06-27 17:44:05.537] [XDCGIVT:00006] [pending submit] [Batch] [user1] [] []
CWLRB3060I: [2012-06-27 17:52:39.120] [XDCGIVT:00007] [pending submit] [Batch] [user1] [] []
CWLRB3060I: [2012-06-27 18:06:30.249] [XDCGIVT:00008] [pending submit] [Batch] [user1] [] []
Viewing details of job schedules
To view the details of previously created job schedules:
- Connect to the server where the job scheduler is active.
- cd WAS_HOME/bin.
- Execute the following command:
-
./lrcmd.sh -cmd=getRecurringRequestDetails -request=<request_name> -host=<job_scheduler_host> -port=<job_scheduler_port> -userid=<userid_job_scheduler> -password=<password_job_scheduler>
For example:
-
./lrcmd.sh -cmd=getRecurringRequestDetails -request=weeklySchedule -host=saw211-RHEL3 -port=9080 -userid=wasadmin -password=need2reset
Output from the lrcmd command showing details of batch job schedule
-
[root@saw211-RHEL3 bin]# ./lrcmd.sh -cmd=getRecurringRequestDetails -request=weeklySchedule -host=saw211-RHEL3 -port=9080 -userid=wasadmin -password=need2reset
CWLRB4940I: com.ibm.ws.batch.wsbatch : -cmd=getRecurringRequestDetails -request=weeklySchedule -host=saw211-RHEL3 -port=9080 -userid=wasadmin -password=********
CWLRB5000I: Thu Jun 28 09:27:13 EDT 2012 : com.ibm.ws.batch.wsbatch : response to getRecurringRequestDetails CWLRB5430I: [weeklySchedule] [2012-07-01 22:00:00] [weekly] [inputDataStream="/tmp/ivtJobs/input-text.txt" supportclassOut="com.ibm.websphere.batch.devframework.datastreams.patterns.TextFil eWriter" checkPoint="10" perfEnabled="true" numberRecords="100" outputDataStream="/tmp/ivtJobs/output-text.txt" supportclassIn="com.ibm.websphere.batch.devframework.datastreams.patterns.TextFile Reader" debugEnabled="false" fileEncoding="8859_1"] []
Checking the batch job logs
After the job is submitted from the Job management console, we can verity the logs to determine if the execution was successful.The job logs are available in the following folder:
-
WAS_HOME/profiles/<PROFILE_NAME>/joblogs
There are two logs to be verified:
- part.0.log
This log shows the initial load and dispatch information for the job, including the dispatch to the grid endpoint that will execute the process. Example 22-7 shows a snippet of the log file.
part.0.log file
CWLRB5684I: [06/20/12 14:22:23:411 EDT] Job XDCGIVT:00000 is queued for execution
CWLRB5586I: [06/20/12 14:22:23:484 EDT] CWLRS6006I: Job class Default,
Importance 8, Service Class null, Service Goal Type 0, Application Type j2ee,
Submitter user1.
CWLRB5586I: [06/20/12 14:22:23:484 EDT] CWLRS6007I: Job Arrival Time 6/20/12


2:22 PM, Goal Max Completion Time 0, Goal Max Queue Time 0, Breach Time 6/21/12
2:22 PM.
CWLRB5586I: [06/20/12 14:22:23:485 EDT] CWLRS6021I: List of eligible endpoints
to execute the job: saw211-RHEL3Node01/batchJVM01.
CWLRB5586I: [06/20/12 14:22:23:486 EDT] CWLRS6011I: APC is not active. GAP will make the endpoint selection.
CWLRB5586I: [06/20/12 14:22:24:863 EDT] CWLRS6013I: GAP is dispatching job
XDCGIVT:00000. Job queue time 1.399 seconds.
CWLRB3090I: [06/20/12 14:22:25:440 EDT] Job XDCGIVT:00000 is dispatched to endpoint saw211-RHEL3Node01/batchJVM01: result: 0
- part.2.log
This output includes any application generated output directed to the System.out and System.err output streams. Example 22-8 shows a snippet of the log file.
CWLRB5610I: [06/20/12 14:22:30:423 EDT] Firing IVTStep3 results algorithm com.ibm.wsspi.batch.resultsalgorithms.jobsum: [RC 0] [jobRC 0]
CWLRB5624I: [06/20/12 14:22:30:503 EDT] Stopping step IVTStep3 chkpt checkpoint. User transaction status: STATUS_ACTIVE
CWLRB5602I: [06/20/12 14:22:30:607 EDT] Closing IVTStep3 batch data stream: inputStream
CWLRB5602I: [06/20/12 14:22:30:608 EDT] Closing IVTStep3 batch data stream: generatedOutputInputStream
CWLRB5604I: [06/20/12 14:22:30:609 EDT] Freeing IVTStep3 batch data stream: inputStream
CWLRB5604I: [06/20/12 14:22:30:609 EDT] Freeing IVTStep3 batch data stream: generatedOutputInputStream
CWLRB5854I: [06/20/12 14:22:30:610 EDT] Job Step [XDCGIVT:00000,IVTStep3]: Metric = clock Value = 00:00:00:005
CWLRB5854I: [06/20/12 14:22:30:611 EDT] Job Step [XDCGIVT:00000,IVTStep3]: Metric = retry Value = 0
CWLRB5844I: [06/20/12 14:22:30:611 EDT] Job Step Batch Data Stream [XDCGIVT:00000,IVTStep3,generatedOutputInputStream]: Metric = skip Value = 0
CWLRB5844I: [06/20/12 14:22:30:612 EDT] Job Step Batch Data Stream [XDCGIVT:00000,IVTStep3,generatedOutputInputStream]: Metric = rps Value = 484,027
CWLRB5844I: [06/20/12 14:22:30:613 EDT] Job Step Batch Data Stream [XDCGIVT:00000,IVTStep3,inputStream]: Metric = skip Value = 0
CWLRB5844I: [06/20/12 14:22:30:614 EDT] Job Step Batch Data Stream [XDCGIVT:00000,IVTStep3,inputStream]: Metric = rps Value = 428,816
CWLRB2600I: [06/20/12 14:22:30:614 EDT] [06/20/12 14:22:30:614 EDT] Job [XDCGIVT:00000] Step [IVTStep3] completed normally rc=0.
CWLRB3800I: [06/20/12 14:22:30:621 EDT] Job [XDCGIVT:00000] ended normally.
Time-based algorithm Commits global transactions at a specified time interval. Record-based algorithm Commits global transactions at a specified number of iterations of the processJobStep method of batch step. Each call to the processJobStep method is treated as iterating through one record. A checkpoint algorithm service provider interface (SPI) is also provided for building additional custom checkpoint algorithms.
Information: Checkpoint algorithms
- Results algorithm