Top-ten monitoring hotlist
Because of the sheer magnitude of monitors and tuning parameters, knowing where to start, what to monitor and which component to tune first is still hard. Follow these top-ten monitoring steps to check the most important counters and metrics of WAS. See Figure 19-2 for a graphical overview of the most important resources to check. Consider the following:
For tips and good starting points on which direction to tune a specific parameter, refer to 19.4, Performance tuning guidelines for respective tuning measures related to this checklist.
Servlets and Enterprise Java Beans
| 1. | Average response Time |
| 2. | Number of requests per second (Transactions) |
| 3. | Live number of HTTP Sessions |
Thread pools
| 4. | Web server threads |
| 5. | Web container and EJB container thread pool |
| 6. | Datasource connection pool size |
Java Virtual Machine
| 7. | Java Virtual Machine (JVM) memory, garbage collection statistics |
System resources on Web, application, and Database servers
| 8. | CPU utilization |
| 9. | Disk and network I/O |
| 10. | Paging activity |
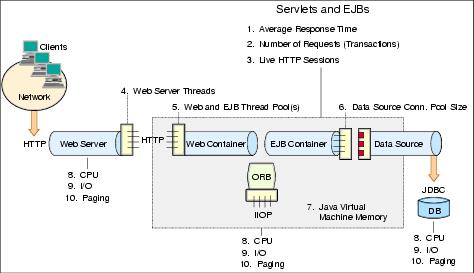
Figure 19-2 Top-ten monitoring items checklist
WebSphere is a trademark of the IBM Corporation in the United States, other countries, or both.
IBM is a trademark of the IBM Corporation in the United States, other countries, or both.
Tivoli is a trademark of the IBM Corporation in the United States, other countries, or both.