|
|
| Configuration settings for profiling
Note that configuration settings for profiling can be accessed from the Window -> Preferences menu of the Workbench. They can be found on the Profiling and Logging page of the Preferences window as displayed in Figure 17-11:
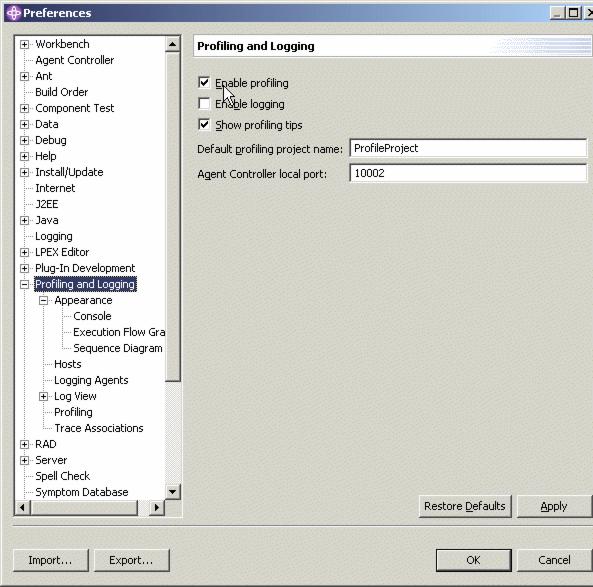
Figure 17-11 Preferences for profiling
|
|
| Ensure that the Enable profiling check box is selected.
|
|
| If the Show profiling tips check box is selected, tips will be displayed periodically during your profiling session.
|
|
| The Default profiling project name can be changed if desired. This specifies under which project in IBM WebSphere Studio Application Developer the profiling data will be stored. Although the Agent Controller local port can be changed, this is usually not necessary. The port specified here must be the same as in the configuration for the Agent Controller. The default is 10002.
|
|
| Select Profiling and Logging -> Profiling for options to set default values for the profiling filters and options. Here you can limit the amount of data to be collected.
|
|
| Select Profiling and Logging -> Appearance to specify the format for Console, Execution Flow Graph and Sequence Diagram. Here you can also specify the resources that will appear in the Profiling Monitor window. As a minimum, the Process, Profiling Agents and Logging agents check boxes should be selected.
|
|
| Select Profiling and Logging -> Appearance -> Sequence Diagram to specify whether recursive calls should be displayed in sequence diagrams that are generated by the profiling tools. Although displaying recursive calls can complicate the sequence diagrams, displaying the recursive calls can be useful in understanding program execution.
|
|
| Select Profiling and Logging -> Hosts to specify a default list of hosts to be used when profiling a remote application.
|
|
Prev | Home | Next
WebSphere is a trademark of the IBM Corporation in the United States, other countries, or both. IBM is a trademark of the IBM Corporation in the United States, other countries, or both. |