15.3.1 Overview
IBM Page Detailer is a graphical tool that enables Web site developers and editors to rapidly and accurately assess performance from the client's perspective. IBM Page Detailer provides details about the manner in which Web pages are delivered to Web browsers. These details include the timing, size, and identity of each item in a page. This information can help Web developers, designers, site operators and IT specialists to isolate problems and improve performance and user satisfaction. Page Detailer can be used with any site that your browser can access.
Page Detailer is a separately downloadable product that can be obtained from IBM alphaWorks at:
http://www.alphaworks.ibm.com/tech/pagedetailer
There are two versions available:
| - | Evaluation version: This version is for free but does not support all features. |
| - | Pro version: This version must be licensed for a small fee and contains the following additional features: |
|
 Full support for HTTPS (SSL) traffic
|
|
|
The supported platforms for Page Detailer are Windows 2000 and Windows XP.
The Page Detailer can monitor all HTTP and HTTPS requests originating from the machine where it is running. Thus it can be used to measure performance for Web applications running either locally or remotely, on either WAS or IBM Rational Application Developer V6.0 or any other Web site or application. Hence the Page Detailer may be used at any time during the project development cycle, from coding through to production support. Note that when analyzing the performance of non-production environments, differences in the production environment topology and configuration could result in differences in the measured performance results.
IBM Page Detailer gathers the following information:

| Connection time |
|
| Socks connection time and size |
|
| SSL connection time and size |
|
| Server response time and size |
|
| Content delivery time and size |
|
| Delays between transfers |
|
| Request headers |
|
| Post data |
|
| Reply headers |
|
| Content data |
|
| Page totals, averages, minimums, and maximums |
For each page that is accessed, a color-coded bar chart of the time taken to load the page items will be generated. The length of a particular bar gives a good idea of the relative time spent in loading that item, as compared to the whole page. You will see that in some cases, items of a page may be loaded in parallel. This will appear in the chart with bars that overlap. The information that is captured by the Page Detailer includes page size as well as sizes of all other items loaded by the browser.
Different colors in the bar indicate how the time was spent.
| - | Page Time (Purple) |
The time taken to load all the components of a page.
| - | Host Name Resolution (Cyan) |
The time spent to resolve the IP address of the host.
| - | Connection Attempt Failed (Brown) |
The time taken to receive an error when a connection attempt is made.
| - | Connection Setup Time (Yellow) |
The time taken to open a socket connection. If a SOCKS server is being used, this is the time to open a socket connection from the browser to the SOCKS server only.
| - | Socks Connection Time (Red) |
The time taken to open a connection from a SOCKS server to the remote site.
| - | SSL Connection Setup Time (Pink) |
This is the time taken to negotiate an encrypted connection between the browser and the remote site, once a normal socket connection has been established.
| - | Server Response Time (Blue) |
This is the time from the browser's request to the receipt of the initial reply, after all the communications setup has been completed. Large responses are broken down into smaller components (packets). The server response time only measures the time to receive the first one.
| - | Delivery Time (Green) |
The time taken to receive all additional data that was not included in the initial response.
An example of a chart produced with Page Detailer is provided in Figure 15-36.
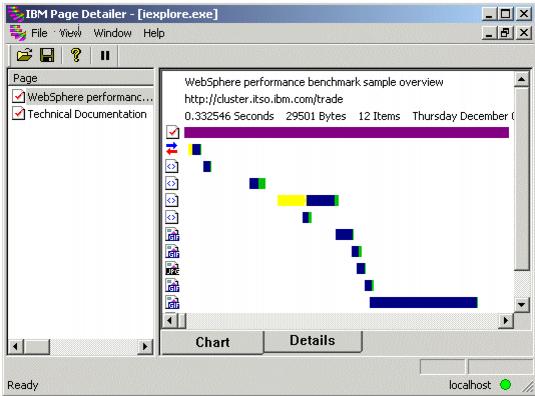
Figure 15-36 Page Detailer Chart view
To obtain more detailed information about a particular HTTP request, double-click the appropriate colored bar or the icon in the chart. This will display a text viewer It includes information about timings, sizes, header, etc. You can add your own notes and save the file for comparison. This feature is available only in the Pro version.
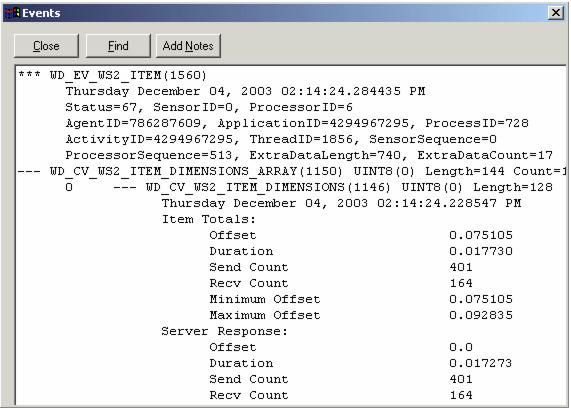
Figure 15-37 Page Detailer Events
In addition to the Chart view, it is also possible to view more details of all HTTP requests using the Details view. This can be seen by selecting the Details tab at the bottom of the window.
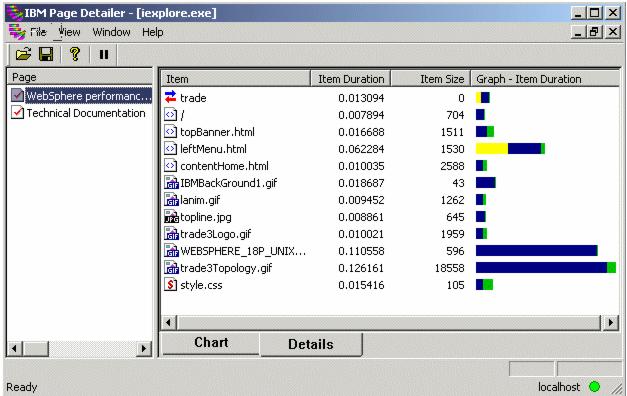
Figure 15-38 Page Detailer Details view