IBM BPM, V8.0.1, All platforms > Authoring services in Integration Designer > Testing modules > Unit testing
Running tests with fine-grained trace
When you are testing business processes, state machines, or mediation flows in the integration test client, you can choose to run your tests either with or without fine-grained trace. If you run your tests with fine-grained trace, the Events area of the test client is populated with additional events that correspond to the elements encountered in the execution path of the component being tested. If the associated component editor is open, the execution path is traced and highlighted in the component editor to enable you to easily see the specific path that was run and tested.
Although fine-grained trace is enabled by default, you can set a preference to disable it, as described in the topic "Enabling or disabling fine-grained trace." If you disable fine-grained trace and you later encounter an exception during your testing, you can enable fine-grained trace again to help you determine the source of the problem. When you test with fine-grained trace and an exception is encountered, the Events area of the test client will display an event that corresponds to the last element encountered in the component execution path before the exception was thrown.
To run a test with fine-grained trace:
Procedure
- Open the integration test client, as described in the topic "Opening the integration test client."
- In the Configurations page of the test client, add a fine-grained trace for one or more components, as described in the topic "Adding fine-grained traces."
- In the Configurations page, select a fine-grained trace and then select the variables that you want to track, as described in the topic "Editing fine-grained traces". When you run a test and then select fine-grained trace events in the Events area of the test client, the values for the selected variables will be displayed in the value editor. (If that you can only select variables for business processes and state machines. If you are testing a mediation flow, there is nothing to select because the message is automatically tracked and the values are automatically collected and displayed in the value editor.)
- In the Events page, ensure that the correct test configuration is selected in the Configurations area.
- In the Module field, ensure that the correct module is selected.
- In the Component field, select a business process, state machine, or mediation flow component for which you added a fine-grained trace.
- In the Interface and Operation fields, ensure that the correct interface and operation are selected.
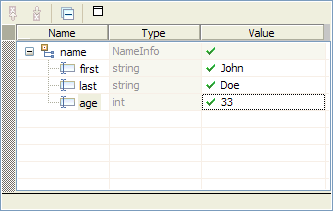
- In the value editor, specify values for the operation:

Information about using the value editor to specify values is found in the test client topic "Value and data pool editors."
- Click the Continue icon

. (If the Deployment Location wizard opens, select the server where you want to deploy your selected module, as described in the test client topic "Deploying modules.") When the invocation has finished, the results are returned and the Events area is populated with both standard test client events and fine-grained trace events, as shown in the following figure:

The fine-grained trace events are those that are nested under the event named Fine-Grained Trace, as shown in the figure.
- In the Events area of the test client, select a fine-grained trace event. If the associated component editor is open beside the test client and if the test client still
has the focus, the corresponding element in the component editor will automatically be selected and highlighted in a different color than the rest of the execution path.
For example, in the figure, the HumanTaskInBPEL event is selected in the Events area of the test client. And in the open business process editor, the corresponding HumanTaskInBPEL activity is automatically selected and highlighted, as shown in the following figure:

You can set a preference to automatically open the appropriate component editor in split-editor mode when you select a fine-grained trace event in the Events area of the test client. Information about setting the preference is found in the topic "Controlling split-editor mode for fine-grained trace".
Results
In the Events area of the test client, you can select each fine-grained trace event that you want to investigate. In addition to examining the corresponding element and execution path in the component editor, in the Detailed Properties area you can also examine the values that were passed or returned for the selected event.