IBM BPM, V8.0.1, All platforms > Authoring services in Integration Designer > Troubleshooting > Use the integration debugger for problem determination > Integration debugger
Debug view in the integration debugger
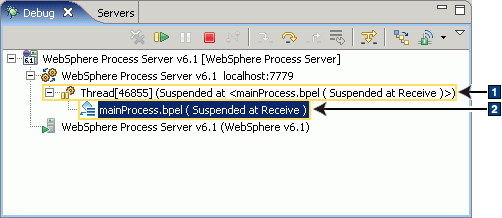
In the integration debugger, you use the Debug view to control the processing of component instances and alter their state at run time. When you start your server in Debug mode and then create and start one or more component instances, the Debug view is populated with component-related entities, such as component threads and stack frames.
The Debug view is shown in the following figure:

The component-related entities shown in the figure are described in the following table:
| Entity | Description |
|---|---|
| 1 | A component thread, which consists of the thread ID
and the thread status. In the Debug view figure, the thread ID
is 46855 and the thread status is:
Suspended at <mainProcess.bpel ( Suspended at Receive ) >) A component thread is identified by one of the following symbols:
|
| 2 | A stack frame, which consists of the component name and the stack frame information. A stack frame is a location indicator that shows you where the component thread is currently paused. For example, in the figure of the Debug view, the stack frame identifies the business process name mainProcess.bpel and the stack frame information (Suspended at Receive). Stack frames are identified by one of the following symbols:
|


