2.12.2 Cache monitor viewing capabilities
For each cache instance configured, you can perform the following actions:
| View the Cache Statistics page and verify the cache configuration and cache data. Click Reset Statistics to reset the counters. |
| View the Edge Statistics page to view data about the current ESI processors configured for caching. Click Refresh Statistics to see the latest statistics or content from the ESI processors. Click Reset Statistics to reset the counters.1 |
| View the Cache Contents page to examine the contents that are currently cached in memory. |
| View the Disk Offload page to view content that is currently offloaded from memory to disk. |
| View the Cache Policies page to see which cache policies are currently loaded in the DynaCache. Click a template to view the cache ID rules for the template. |
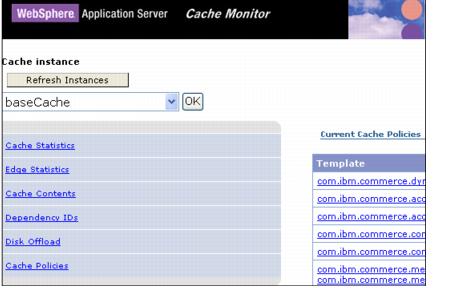
Figure 2-21 Cache monitor viewing capabilities
When you are viewing contents on memory or disk, you can click:

| 
|
| A template to view all entries for that template |
|
|
|
| A dependency ID to view all entries for the ID |
|
|
|
| The cache ID to view all the data that is cached for that entry |
1This has been the source of a lot of APARS. Prior to WebSphere Application Server v6.1, any and only one server in a cluster would show the status and contents of all WSI caches configured to work with DynaCache.