Tivoli Composite Application Manager for WebSphere v6.1
Overview
IBM Tivoli Composite Application Manager (ITCAM) for WebSphere and J2EE monitors the status of transactions in the application server farm and provides a complete history of performance and availability and a real-time Visualization Engine. Use it to...
- Find the root cause of problems
- Troubleshoot them quickly
- Enable capacity planning and sizing within a business context.
ITCAM for WebSphere provides problem determination, availability monitoring, and performance analysis for enterprise WebSphere applications running on Windows, UNIX, OS/400, and z/OS environments.
Monitors heterogeneous environments consisting of both mainframes and distributed systems.
For detailed information, see the ITCAM for WebSphere infocenter.
Administration includes...
Account Management
Account Management contains...
- User Profiles
Manage user accounts
- Role Configuration
Display system default and custom roles.
Server Management
Server Management contains...
- Server Groups
- Create
- Duplicate
- Delete
- Data Collector Configuration
Create DC configuration libraries. Users can enable JDBC for TTAPI from Data Collector Configuration.

Transaction Tracking Application Programming Interface (TTAPI) integrates ITCAM for WebSphere and ITCAM for Transactions (ITCAMfT).
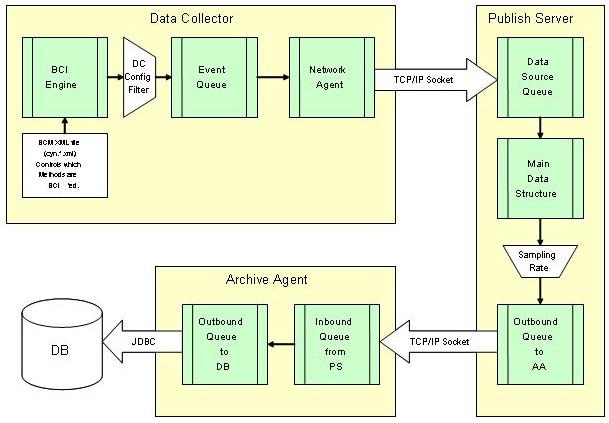
Data Flow

Monitor on Demand
Three monitoring levels for each group or server...
In L2, you will be given the option to check MP for Method Profiling, enabling determination of how often the data collector will send the data to the managing server. Range is 1-999 minutes.
You can view the method profile reports on the Method Profiling Management page. Create a schedule to apply to a server or group of servers.
Managing Server
The managing server contains...
- System Properties
In System Properties, maintain the system settings for ITCAM for WebSphere and J2EE. Also control the settings for the following properties:
- Data Collection settings
- Enterprise Overview display
- SNMP Network
- Self-Diagnosis
The Self-Diagnosis enables you to view all ITCAM for WebSphere and J2EE components and their states and attributes. The page consists of the following components...
- kernel
- data collector
- publish server
- global publish server
- polling agents
- archive agent
- message dispatcher
ITCAM for WebSphere and J2EE is designed to work as a loosely-coupled system, so the components can be up or down without affecting the integrity of the whole system.
Availability
Availability includes...
- Systems Overview
- Server Statistics Overview
- Recent Activity Display
- System Resources
- SMF data
Systems Overview includes overviews of...
Enterprise Overview
The Enterprise Overview page displays information for all groups of servers. It provides the highest level view of health status for the Data Center. Additional data displayed on the page includes completed requests for the group. Links are available for each of the groups to further investigate the availability, to compare resource use, and to search the group information for a request.
Group Overview
The Group Overview page provides a high-level overview of activity for each server in the group. Specifically, the overview includes the response time and throughput for the last hour as well as the current monitoring level for each server. You can analyze this data in order to ascertain whether the servers in the group are functioning properly.
Server Overview
The Server Overview page displays comprehensive server information, activity and statistics for the selected server. View the summary data to understand the status of the applications and application server behavior. This page provides vital information for determining the health of a server.
Portal Overview
The Portal Overview page helps you assess the portals in the system and how they are operating. You can monitor the status of the portals from the slowest portals to the portals with the highest throughput for the last hour. In addition, you can view the metrics for the portals including Response Time for Portal Pages/Gateway Servlet, Portlets, Model Building, Page Loading, Authentication and Authorization.
Server Statistics Overview
The Server Statistics Overview helps you compare activity and related platform data across servers so that you can recognize problems.
System Resources
The System Resources page displays summary information for all resources on the selected application server. From the System Resources, you can use the left navigation to switch the view to data on different categories, such as, EJBs, SQL, MQI, System, Object Request Brokers (ORB), Session Manager, Web Module, Thread Pools, Transactions, and Web applications.
SMF Data
The SMF data displays detailed information on...
- Server
- EJBs
- Servlet Session Manager
- Web applications
- Server Regions
The source of the data comes primarily from the SMF records published periodically by WebSphere . As these records are published, the Application Monitor intercepts the transfer of the records and makes a copy in real time before writing it to the SMF dataset. SMF Data is only available for z/OS Data Collectors.
Workload Manager
The Workload Manager feature offers a way to view selected data from the Workload Manager (WLM) for z/OS and OS/390 , for the address space associated with a particular server, as well as its associated service class data, service class period, and enclave data. This feature is only available for z/OS servers.
The Workload Manager feature is not available directly from the top-level navigation. It is available through the Tools button on the Server Overview (within the Systems Overview feature) and the Server Statistics Overview, for z/OS servers.
Recent Activity Display
The Recent Activity Display helps you investigate potential memory problems relating to garbage collection and the JVM heap size. At times garbage collection may not clean up properly or the heap may have too little memory allocated. Use Recent Activity Display to create a server activity analysis report.
Problem Determination
Problem Determination includes the Alerts and Events, Problem Center, In-Flight Request Search, Server Activity Display, Web Session Browser, Memory Diagnosis, JVM Thread Display, Software Consistency Check, and Trap and Alert Management.
Alerts and Events
Monitor high-priority trap alerts and Tivoli Enterprise Portal (portal) events for the last 24 hours from the Alerts and Events tab. In addition, an escalate feature is available that you can use to transfer an alert to the Problem Center for more detailed diagnosis and tracking. Use advanced filtering to limit the number of alerts that display.
Problem Center
All problems are escalated from high-priority trap alerts and portal events. The details of each problem are available for the review. Each contains a snapshot of the problem details and the state of the application server at the time the problem occurred. Use advanced filtering to limit the number of problems in the list.
In-Flight Request Search
The In-Flight Request Search page lets you search for a request on the application servers. To search for a request, enter in the request using alpha numeric characters or a URL string or leave it blank to search for everything. You may also view the stack trace, component trace, or method trace for a particular request. View, e-mail, or export the PDF file of the trace to other ITCAM for WebSphere and J2EE users.
PDF generation is inactive until the site completes the iText integration instructions in Appendix K of the IBM Tivoli Composite Application Manager: Managing Server Installation and Customization Guide.
Server Activity Display (SAD)
The Server Activity Display page provides thread data for an application server at a specific point in time, lock contention, as well as the 100 most recently completed requests. You may filter the threads by the type or thread status. This limits the list to the type of threads you want to view. After pinpointing a hung thread, click the Thread ID link to review its request detail. Click links to view the stack trace, component trace, or method trace. View, export, or e-mail the PDF file of the trace to other ITCAM for WebSphere and J2EE users.
Web Session Browser
The Web Session Browser retrieves information on HTTP sessions. You can search a server, a group, or all servers and groups for a specific session. After activating the search, the system will take a snapshot of the server(s) and return a list of sessions.
Memory Diagnosis
The Memory Diagnosis section helps you discover memory related problems. Memory Analysis lets you create server activity analysis reports regarding memory. Memory Diagnosis includes the following features: Memory Analysis, Heap Analysis, Memory Leak, and Heap Dump Management. Heap Analysis captures the runtime heap of an application server and breaks it down by the class names of the objects residing in the heap at the time of the snapshot while providing the number of instances and the size of the information. Memory Leak helps confirm the existence of a memory leak and identifies the most likely memory leak candidates. The Heap Dump Management provides a list of all the previously taken heap dumps. Heap Dump files can be viewed using Memory Dump Diagnostic for Java (MDD4J).
JVM Thread Display
The JVM Thread Display shows all the threads running on the JVM, organized within thread groups. In addition, the JVM Thread Display provides a Thread Dump so you can view detailed information about resource consumption in a JVM. In addition, you can click a thread to view the details for the thread, or to view a stack trace, change the thread priority, or cancel a thread.
Software Consistency Check
View runtime environment and installed binaries information for your entire server farm through the Software Consistency Check. Use the Runtime Environment Comparison on a selected server or compare one properly functioning server to up to ten other servers in the farm, or use the Installed Binary Comparison on a selected server or compare one properly functioning server to up to five other servers in the farm. These functions help you locate files that have not been updated or do not match.
Trap and Alert Management
Set software traps and alerts to monitor a group of servers or a selected server. By setting traps and alerts, notifications are sent immediately when the system meets the conditions of the trap. Actions include sending an e-mail or an SNMP message, collecting Stack Trace, Component Trace, Method Trace, or Thread Dump. View the Trap History on the Trap Action History page of a trap that met the set conditions.
Performance Analysis
Performance Analysis includes the Create Reports (Application Reports and Server Reports), View Saved Reports, Method Profiling, and Daily Statistics sections.
Performance Analysis and Reporting (PAR)
- Analyze application and application server data.
- Create and view reports for a group of servers or a selected server.
- Analyze data for requests, methods, SQL calls, server availability, and system resources.
- Decompose reports by server, request type, or application.
- E-mail or view a PDF file of a report
- Export a PDF file to a comma-delimited file format.
PDF generation is inactive until the site completes the iText integration instructions in Appendix K of the IBM Tivoli Composite Application Manager: Managing Server Installation and Customization Guide.
Method Profiling
Method Profiling provides information on methods regarding response time, CPU time, and execution.
Daily Statistics
Daily Statistics provide daily SMF information snapshots for z/OS WebSphere servers only. The ITCAM for WebSphere z/OS Data Collector gathers the day's SMF data for all servers running z/OS WebSphere instances every night at midnight.
Help
Find answers to the questions using ITCAM for WebSphere and J2EE online Help. Use the Contents tab to browse through the available Help topics; Index tab for an alphabetical listing of all our help text; and Search tab to find the answer to a specific question.
Tweak ISA
You provide the IP address/Hostname and HTTP port number to configure the IBM Support Assistant (ISA) program which will enable you to launch ISA to help support with troubleshooting.
Launch ISA
When you launch the ISA program through the ITCAM for WebSphere and J2EE Managing Server, you can use the ITCAM product tool to activate a script that will create a tar file that helps the support team diagnose any problem you may experience while using ITCAM for WebSphere and J2EE.
About
Provides the current version number for ITCAM for WebSphere and J2EE and trademark information, regarding pending and approved trademarks for ITCAM for WebSphere and J2EE and International Business Machines Corporation.
Account Management
Purpose
Account Management enables you to control users' access to features and servers. Use roles to restrict access to features, and use server groups to grant access to servers.
Usage Overview
This feature helps you:
- Grant access to ITCAM for WebSphere and J2EE by creating new user accounts.
- Control access to servers by associating server groups with user accounts.
- Restrict access to features by assigning an appropriate role to each user account.
User Scenarios
Scenario 1: Granting members of Team XYZ access to ITCAM for WebSphere and J2EE
Team XYZ has asked for access to ITCAM for WebSphere and J2EE, but only needs access to features that use historical data. Since the existing roles provide access to features that use both real time and historical data, create a new role for them called team XYZ. When you define this role, provide access to features that use only historical data, for example PAR.
Assign role team_XYZ to each user account belonging to members of team XYZ.
Scenario 2: Creating an account for a new employee
Employee John Smith is an operator that just joined the company.
John will need to use ITCAM for WebSphere and J2EE to monitor QA systems. As the ITCAM for WebSphere and J2EE administrator, you create John's account with access granted to QA server groups but not Production server groups. Furthermore, you restrict John's access to features by assigning the Operator role to his account.
User profiles
The following instructions indicate how to manage user accounts within ITCAM for WebSphere and J2EE. In ITCAM for WebSphere and J2EE, the user name can be different from the WebSphere user name, but it must be at least 3 alpha characters and no more than 50. Multiple ITCAM for WebSphere and J2EE user accounts may use the same WebSphere account. In addition, multiple concurrent logins under the same ITCAM for WebSphere and J2EE user account are allowed. ITCAM for WebSphere and J2EE uses WebSphere Global Security system for user authentication. Therefore, a valid OS/LDAP user name is required to create a new account. This means password maintenance is performed outside of ITCAM for WebSphere and J2EE.
Create a user account
Add new user accounts to ITCAM for WebSphere and J2EE on the Create User Account page. Limit the rights of the user accounts to the groups of servers you select. All user accounts must have an existing WebSphere user name in order to authenticate.
To create a user account:
- From the top navigation, click Administration > Account Management > User Profiles.
The User Profiles page opens.
- On the left navigation, click Create User Account.
The Create User Account page opens.
- Enter the first name (required).
- Enter the last name (required).
- Enter the user name (required).
- Enter the OS/LDAP user name (required). ITCAM for WebSphere and J2EE uses WebSphere Global Security system for user authentication. Therefore, a valid OS/LDAP user name is required to create a new account.
- Select the role you want to assign to the user account from the drop-down menu.
- Select Active or Suspend for the Account Status. A user account is not ready for use if its status is not marked Active. You may want to suspend the user accounts when the operators are on leave. When they return, select Active to turn their user accounts back on.
- Enter the user's E-mail Address (optional).
- Enter Remarks in the available fields (optional).
- Click to select the Group name in the All Groups box.
- Click Add to grant the user account rights to the selected groups.
- To save the user account setup, click Save.
Modify a user account
Modify existing user accounts in ITCAM for WebSphere and J2EE on the Modify User Account page. Limit the rights of the user accounts to the groups you select.
To modify a user account:
- From the top navigation, click Administration > Account Management > User Profiles.
The User Profiles page opens.
- Click the user name to select the user account you want to modify.
The Modify User Account page opens.
- Select the field you want to edit, and enter the new information.
- After entering the changes, click Save.
Delete a user account
Keep the system up-to-date by deleting old and unused ITCAM for WebSphere and J2EE user accounts. You can delete existing user accounts on the User Profiles page.
To delete a user account:
- From the top navigation, click Administration > Account Management > User Profiles.
The User Profiles page opens.
- Click X or Delete on
the last column of the user account to delete from ITCAM for WebSphere and J2EE.
A confirmation box displays.
- Click OK in the confirmation box to delete the account, or click Cancel to return to the User Profiles page.
- If we select OK, the system deletes the user account and the User Profiles page no longer displays the deleted account.
- To sort by heading, click the heading you want to sort. Only underlined headings can be sorted. When the page refreshes, the results display sorted by the selected heading and verify that the account is gone.
Role configuration
In order to control user account accessibility to WAS functions, each user account will be assigned a role that grants access to specific product functions. A role maps to individual product functions based on the following four sections of the system: Administration, Availability, Problem Determination, and Performance Analysis. There are three system default roles created in the Role configuration page, namely Administrator, Operator and User. These roles cannot be deleted. The administrator role has the permission to create custom roles to suit the needs of the specific environment.
After setting up the custom roles, the administrator assigns a role to each user account. For example, the administrator creates a custom role for the Trading application and then selects the operations that data center operators need to monitor the trading functions.
Create a role
The Create Role page provides the functionality to create a custom role for the environment. Design the custom role to restrict and grant privileges specific to the needs of the environment.
To create a role:
- From the top navigation, click Administration > Account Management > Role Configuration.
The Role Configuration page opens.
- On the left navigation, click Create Role.
The Create Role page opens.
- Type in the name of the new role.
- Click OK.
The new role displays on the Role Configuration page.
- Click to select the features user accounts will access in ITCAM for WebSphere and J2EE.
- Click Save.
Duplicating a role
To customize a new role, you may duplicate an existing role that uses a similar set of permissions instead of checking or unchecking the boxes one by one repeatedly.
To duplicate a role:
- From the top navigation, click Administration > Account Management > Role Configuration.
The Role Configuration page opens.
- On the left navigation, click Duplicate Role.
The Duplicate Role page opens.
- Select a role name for the duplicated role from the Role Name drop-down menu.
- Enter a new name for the duplicated role.
- Click Save.
The newly duplicated role displays on the Role Configuration page.
- Click to check or uncheck the features user accounts will access in ITCAM for WebSphere and J2EE.
- Click Save. The duplicated role does not have any users since its user-to-role relationship is not duplicated.
Modify a role
The Role Configuration page provides the functionality to modify the custom roles. Update and delete custom roles based on the needs of the environment.
To modify a role:
- From the top navigation, click Administration > Account Management > Role Configuration.
The Role Configuration page opens.
- Change the custom role privileges users will access in ITCAM for WebSphere and J2EE.
- Click Save.
- Click Reset to revert to the pre-modified settings.
Assigning a role
After creating a new role on the Role Configuration page, assign the role to user accounts on the Modify User Account page. You may also modify user accounts to assign appropriate privileges to them.
To assign a role:
- From the top navigation, click Administration > Account Management > User Profiles.
The User Profiles page opens.
- Click the user name to assign a role.
The Modify User Account page opens.
- From the Role drop-down menu, select the role to assign to the user account.
- Click Save. You must have a role to use the application.
Delete a role
The Role Configuration page provides the functionality to delete the custom roles. Manage the custom roles based on the needs of the environment. In addition, you cannot delete a role while the system associates a user account with it.
To delete a role not assigned to a user account:
- From the top navigation, click Administration > Account Management > Role Configuration.
The Role Configuration page opens.
- Click the X next to the role you want to
delete.
A confirmation box displays.
- Click OK in the confirmation box to delete the role, or click Cancel to return to the Role Configuration page.
To delete a role still assigned to a user account:
- From the top navigation, click Administration > Account Management > Role Configuration.
The Role Configuration page opens.
- Click the X next to the role you want to
delete.
A confirmation box displays.
- Click OK at the confirmation box.
A list of the user accounts assigned to the role is displayed. Since the system assigned the role to a user account, you have to change the role of the user account on the Update Role page.
- Click the link to select the user account.
The Modify User Account page opens.
- Click to select a role for the user account from the Role drop-down list.
- Click Save.
The system displays the Role Configuration page without the deleted role.
Server Management
Purpose
Use the Server Group Management page to add and delete server groups, while you associate groups with individual accounts.
Restrict users' access to data and operations to a specific group of servers.
Usage Overview
This feature helps you:
- Control access to servers by associating server groups with user accounts.
- Divide the servers into server groups according to lines of business, authority structure, or based on the needs.
User Scenarios
Scenario 1: Separating server groups according to applications
As the ITCAM for WebSphere and J2EE administrator, you want to distinguish the group of servers that process trading requests from the group of servers that process quote requests. You create two server groups: Trading and Quotes. In the Trading server group, you include only those servers that deal with trading, and in the Quotes server group you include only those servers that deal with quotes. Grant users access to the appropriate server group(s).
Scenario 2: Grouping servers by authority structure
As the ITCAM for WebSphere and J2EE administrator, you want to separate the servers in the environment by the authority structure present in the company. The current Support team is separated into smaller groups that control individual groups of servers. You create server groups that contain these servers such as Support A controls servers 1 through 29, Support B controls servers 30 through 59 and Support C controls servers 60 through 90.
Server Groups
The following instructions indicate how to manage the groups in ITCAM for WebSphere and J2EE. Only configured servers appear in the list of servers available to group, but servers do not have to be up and running to appear. While creating groups, use only alphanumeric characters in the name (except +, ', ", \,` ,~, * and #). Group names are case-sensitive. In a z/OS environment, server instances are grouped, not the server regions. Server regions that belong to a server instance are automatically grouped under that server instance, and they are distinguished from a server instance by having the address space ID appended to the end of their server name. Unassigned Servers is a pre-defined server group. By default, all configured data collectors are in the Unassigned Servers group..
Create a group
Combine servers into groups to streamline daily server maintenance. The Create group page provides the functionality to create groups of servers and grant users access to those groups.
To create a group:
- From the top navigation, click Administration > Server Management > Server Groups.
The Server Group Management page opens.
- On the left navigation, click Create group.
The Create group page opens.

- Enter a unique Group Name in the text box. (Required field.)
- Enter a Description in the text box.
- Enter the Server Group Response Time Thresholds.
- Enter the Portal Response Time Thresholds. (If we have a portal server, configure the thresholds for portal.) (Optional.)
- Click to select a baseline definition and fill out the information.
Steps 5 through 7 are all default settings based on the settings on the System Properties page under Tweak the Enterprise Overview Display section.
- Click to select a server name in the All Servers box.
To select multiple servers contiguously, hold down the shift key during the selection. To add multiple servers non-contiguously, Ctrl + click the servers for selection.
- Click Add to select a server in the Group.
The server name is displayed in the Servers In Group box.
- In the Servers In Group box, select the server you want to remove and click Remove to delete the server from the group.
The server name is no longer displayed in the Servers in Group box.
- Select the user and click Add to grant users access to the group.
The user name is displayed in the Granted Access box.
- Click Remove to remove the user's access to the group.
The user name is no longer displayed in the Granted Access box.
- Click Save to save the group's settings.
Modify a group
Maintain the groups with the most updated definition. The Modify Group page lets you modify the groups and grant users access to those groups. Changes made to the server-to-group assignments and user-to-group grants occur immediately.
If an administrator removes a server from a group, anyone logged in will notice the change.
To modify a group:
- From the top navigation, click Administration > Server Management> Server Groups.
The Server Group Management page opens.
- Click the Group Name of the group you want to modify.
The Modify Group page opens populated with the selected group's information.
- Select the field you want to edit and enter the new information.
- Click Save to save the group's settings.
Delete a group
Delete outdated groups from the system. You can delete existing groups on the Server Group Management page. Once a group is deleted, the records in the ITCAM for WebSphere and J2EE database that belong to the group via the server relationship will no longer be accessed through the group. However, they can still be accessed either via the server name or another group which contains the servers. When you try to delete a group from the ITCAM for WebSphere and J2EE database, you will first be shown a list of all reports that involve that group, which delete before the group can be deleted. Click the link of each report in the list and confirm to delete it. When you delete all reports that involve the group, the group will be deleted.
To delete a group:
- From the top navigation, click Administration > Server Management > Server Groups.
The Server Group Management page opens.
- Click X or Delete next to the group name you want to delete from ITCAM for WebSphere and J2EE.
- Click OK in the confirmation box to delete the group, or click Cancel to return to the Server Group Management page.
- If we select OK, the system deletes the group and the Server Group Management page no longer displays the deleted group.
Duplicating a group
Duplicating a group enables you to quickly create a new group based on the settings of an existing group. The Duplicate Group link will not appear when there is no group in the system. The duplicated group does not have any users since its user-to-group relationship is not duplicated.
To duplicate a group:
- From the top navigation, click Administration > Server Management > Server Groups.
The Server Group Management page opens.
- On the left navigation, click Duplicate Group.
The Duplicate Group page opens.
- From the Group Name drop-down menu, select the group name you want to duplicate.
- Enter a new name for the duplicated group.
- Click Save to duplicate the group.
Data Collector Configuration
The Data Collector section provides lists of configured and unconfigured data collectors. A data collector is software that runs within the same JVM as the application server and captures information regarding the applications running inside the application server. At times, it may be necessary to unconfigure data collectors on the application server or configure new data collectors.
In a z/OS environment, a WebSphere server instance is represented by a data collector definition. It serves as a template for all the data collectors in the server regions belonging to the same server instance. This means that while you may be configuring the data collector for a server instance, the configuration is actually used by all the data collectors in the server regions when monitoring the applications.
Tweak a data collector
Use Data Collector Configuration to configure the data collectors. To see the unconfigured data collectors, click the Unconfigured Data Collectors link. When you configure a data collector, the system removes it from the unconfigured data collectors list and displays it with the configured data collectors. You can also apply a configuration to a data collector from the Apply page, see Applying a configuration.
For WebSphere v5, the data collector name is formed from the Admin Server name (node name) and the application server instance name. For WebSphere v6, the data collector application server name also includes the profile name. For example, here is a sample WebSphere v5 name: jupiterCell01.jupiterNode01.server1. Here is a sample for the corresponding WebSphere v6 name: jupiterCell01.jupiterNode01.server1(default). In many places, an additional field is appended to the end of the data collector name that indicates whether the data collector is associated with a currently running application server instance or not. When the application server instance and data collector is running, this field is the process or address space identifier: jupiterCell01.jupiterNode01.server1.12345. When the data collector is not running and there is no process or address space identifier, two dashes (--) are used... jupiterCell01.jupiterNode01.server1.--
To configure a data collector:
- From the top navigation, click Administration > Server Management > Data Collector Configuration.
The Configured Data Collector Overview page opens.
- Click the Unconfigured Data Collectors link in the left menu.
- Select a configuration from the Apply a Configuration drop-down menu.
- Click Select All or click in the individual check box of the unconfigured data collector you want to configure.
- Click Apply.
The data collector displays in the list of configured data collectors.
Unconfiguring a data collector
Use the Configured Data Collector Overview page to unconfigure the data collectors. In general, there is only one scenario that requires you to unconfigure a configured data collector: If we decide to retire or re-deploy an application server, unconfigure the data collector and the system will remove its configuration record from the ITCAM for WebSphere and J2EE database. When you unconfigure a data collector, the system removes it from the configured data collectors list and displays it with the unconfigured data collectors. If the data collection has reports associated with it, you are prompted to delete those reports before unconfiguring the data collector.
To unconfigure a data collector:
- From the top navigation, click Administration > Server Management > Data Collector Configuration.
The Configured Data Collector Overview page opens.
- Place a check in the Unconfigure check box next to the data collector you want to unconfigure.
- Click Apply.
The Unconfigured Data Collector Overview page displays.
Disabling a data collector
To stop the data collector from sending and receiving data, you can disable the data collector. This is similar to a pause as opposed to unconfiguring the data collector (which would cause data to be lost.)
To disable a data collector:
- From the top navigation, click Administration > Server Management > Data Collector Configuration. The Configured Data Collector Overview page opens.
- Click Disable next to the data collector
you want to disable.
The system disables the data collector and the button changes to Enable.
Enable a data collector
Enable the data collectors on the Configured Data Collector Overview page. Manage monitoring on the system by enabling and disabling data collectors as needed. If we stopped the data collector from sending and receiving data by disabling it, you can enable the data collector again when you are ready. Since a disabled data collector doesn't lose settings, you can simply turn it back on without any reconfiguration.
To enable a data collector:
- From the top navigation, click Administration > Server Management > Data Collector Configuration.
The Configured Data Collector Overview page opens.
- Click Enable next to the data collector
you want to enable. The system enables the data collector and the
button face changes to Disable.
If we stopped the data collector from sending and receiving data by disabling it, you can enable the data collector again when you are ready. Since a disabled data collector doesn't lose settings, you can simply turn it back on without any reconfiguration.
Creating a configuration
To create a configuration. To focus on classes of interest, ITCAM for WebSphere and J2EE provides the capability to exclude irrelevant classes. For example, library functions, classes from unrelated applications, or well tested classes might not be worth tracing. Group those classes you do not want to monitor in the Exclude (Classname) list. Any classes that are not in the list will be monitored.
If the Exclude (Classname) list of classes is too broad and you want to monitor a subset of the lower level classes, put them in the Exclude Override (Classname) list.
For example, the Exclude (Classname) list may include com.sun.*, while the Exclude Override (Classname) list includes com.sun.java. This means that ITCAM for WebSphere and J2EE will not monitor any com.sun classes except the Java classes.
If we are monitoring composite requests for applications that use MQ as a mechanism to bridge J2EE and CICS or IMS, then configure each participating data collector to monitor MQ.
Name the configuration for the data collectors. Create multiple configurations that monitor different classes.
To create a configuration:
- From the top navigation, click Administration > Server Management > Data Collector Configuration.
The Configured Data Collector Overview page opens.
- Click Create a Configuration on the left
navigation.
The Create page opens.
- Enter the names of classes you want to ignore into the Exclude (Classname) list.
You can use the * as a wildcard. In this case it means include all.
- Enter the names of classes you want to monitor into the Exclude Override (Classname) list.
- Select the check box to enable the MQ list.
This will provide you with an Exclude and Exclude Override box specifically for configuring MQ.
- Enter a name for the configuration. (This is a required field.)
- Click Save to create the configuration or Save & Apply to create the configuration and apply it to a data collector. Configure or change these options at any time.
Applying a configuration
Use the Apply page to apply a configuration to a data collector.
To apply a configuration:
- From the top navigation, click Administration > Server Management > Data Collector Configuration.
The Configured Data Collector Overview page opens.
- Click Configuration Library on the left
navigation.
The Data Collector Configuration List page opens.
- Click the Apply icon next to the configuration you want to apply.
The Apply page opens.

- Click to select data collector name(s) from the All Data Collectors box. To select a range of contiguous data collectors, hold down the shift key during the selection. To add multiple data collectors non-contiguously, Ctrl + click the servers for selection.
- Click Add to apply the configuration to
the data collector(s).
The data collectors' names appear in the Applied box.
- Select Enable from the Status drop-down menu to set the status of the configuration.
- Click Apply.
Modify a configuration
You can modify an existing configuration for the data collectors by updating the list of classes you monitor. Remove and add classes to the Exclude (Classname) list and Exclude Override (Classname) list to change what you monitor.
To modify a configuration:
- From the top navigation, click Administration > Server Management > Data Collector Configuration.
The Configured Data Collector Overview page opens.
- Click Configuration Library on the left navigation.
The Data Collector Configuration List page opens.
- Click the Modify icon next to the configuration you want to modify.
The Modify page opens.
- Enter the names of classes you want to ignore into the Exclude (Classname) list.
- Enter the names of classes you want to monitor into the Exclude Override (Classname) List.
- Select the check box to enable the MQ list.
- Click Save to save the modifications to
the configuration.
The Configured Data Collector Configuration List displays with the updated information.
Duplicating a configuration
You can duplicate an existing configuration from the data collectors. Duplicate a configuration based on the selections made in an existing configuration.
To duplicate a configuration:
- From the top navigation, click Administration > Server Management > Data Collector Configuration.
The Configured Data Collector Overview page opens.
- Click Configuration Library on the left
navigation.
The Configured Data Collector Configuration List page opens.
- Click the Duplicate icon next to the configuration you want to
duplicate.
The Duplicate Configuration page opens.
- Select an existing configuration from the drop-down menu.
- Enter a new name for the configuration.
- Click Save.
The new configuration displays in the Configuration List.
Delete a configuration
You can delete outdated configurations from the list to keep the list current. When you delete a configuration, the data collectors using that configuration will be unconfigured. See Creating a configuration and Applying a configuration to configure those data collectors. Remember to apply a new configuration to the servers you unconfigured while deleting the configuration.
To delete a configuration:
- From the top navigation, click Administration > Server Management > Data Collector Configuration.
The Configured Data Collector Overview page opens.
- Click Configuration Library on the left navigation.
The Data Collector Configuration List page opens.
- Click the Delete icon next to the configuration you want to delete.
A confirmation box is displayed to warn you that deleting this configuration will unconfigure all the associated servers.
- Click OK to delete the configuration.
The Configuration List displays without the deleted configuration. Remember to apply a new configuration to the servers you unconfigured while deleting the configuration.
Managing Server
The Managing Server section is separated into two categories:
- System Properties
- Self-Diagnosis
System Properties enables you to tune ITCAM for WebSphere and J2EE, while Self-Diagnosis provides you a method for debugging the managing server when problems arise.
Usage Overview
This feature helps you:
- Define the global and default data collection settings.
- Setup the default baseline settings for the Enterprise Overview display.
- Set the SNMP Network configuration. (Support for SNMP is only available in ITCAM for WebSphere and J2EE 6.1.)
- Service ITCAM for WebSphere and J2EE by viewing the individual components running on the system.
System Properties
The System Properties are separated into three sections:
- Data Collection Settings
- Enterprise Overview
- SNMP Network Settings
Control the setup of ITCAM for WebSphere and J2EE using these properties.
Tweak the data collection settings
Use the Data Collection Settings to set and modify the system settings for the managing server to regulate the frequency of data collection, the percentage of data stored, the level of monitoring, and the number of event records stored in traces. A data collector will stay at the default monitoring level unless a schedule overrides it or you override it.
To configure the Data Collection Settings:
- From the top navigation, click...
-
Administration | Managing Server | System Properties
Figure 3. Data Collection Settings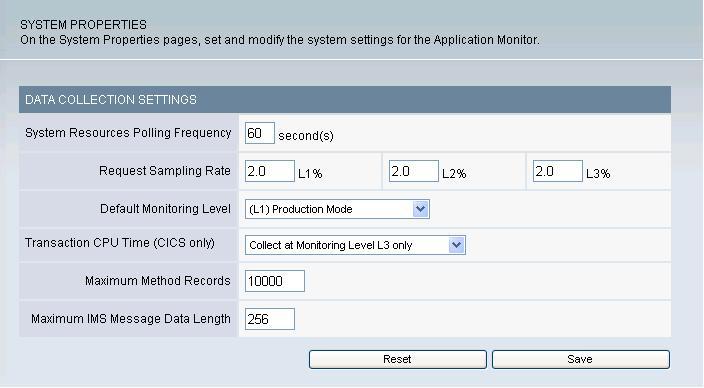
- Enter the appropriate value for the following properties:
System Resources Polling Frequency – Set how often the system resources information is requested from the appservers. The default setting is 60 seconds.
Request Sampling Rate – The percentage of requests stored in the database for reporting and analysis. The default request sampling rate is 2%. There can be a distinct sampling rate for each monitoring level. Data collectors use the sampling rate associated with their current monitoring level.
Default Monitoring Level – The currently set default monitoring level for all servers connected to the application monitor. This is the case when configuring a server for the first time and bringing up the server under the management of the application monitor. The default monitoring level for the non z/OS platform is L2 (Problem Determination). As for the z/OS platform, the default monitoring level is L1 (Production Mode). The monitoring levels are as follows:
Transaction CPU Time (CICS only) –
This field indicates whether the CPU times for a CICS transaction will be collected or not. The CPU times for CICS tasks are reported, but if we want to avoid overhead from the data capture, adjust these settings as necessary.
Options...
- Do Not Collect
- Collect at Monitoring Level L1, L2, and L3
- Collect at Monitoring Level L2 and L3
- Collect at Monitoring Level L3 only
Maximum Method Records – The maximum number of method trace records. The records will be cycled through, showing the 10,000 (or Maximum Method Records value) most recent methods in the system. The default value is 10,000.
Maximum IMS Message Data Length – The maximum length (in bytes) of the IMS message that is displayed.
- Click Save.
Tweak the Enterprise Overview
Use the Enterprise Overview settings to set the Baseline Indicators and the Baseline Definitions. The Baseline Indicators consist of two settings: the percentages above the baseline that you determine to be slow, and very slow. Baseline Definitions define the performance you want to use as a standard of comparison.
To configure the Enterprise Overview display:
- From the top navigation, click Administration
> Managing Server > System Properties.
The System Properties page opens.
- On the left navigation, click Enterprise Overview Display.
The Enterprise Overview Display page opens.
Figure 4. Enterprise Overview display
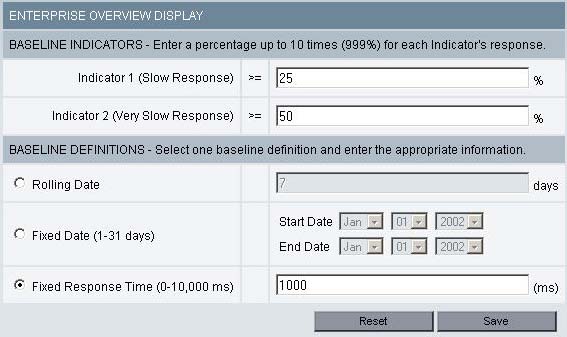
- Enter the appropriate value for the following properties:
Baseline Indicators – The percentage above the baseline that indicates slow or very slow response time. Slow response means the present response time is between 26% and 50% of the baseline; Very slow response means the present response time exceeds 50% of the baseline. All averages are over 5 minute intervals. For example: If Indicator 1 is set to 25%, and Indicator 2 is set to 50%, average response times between 125% and 150% of the baseline are considered slow response. Average response times above 150% of the baseline are considered very slow response.
- Baseline Definitions – The method to be used for
determining the response time baseline.
- Rolling Date – Historical response time data for this number of days is averaged to determine the baseline.
- Fixed Date – Baseline is the average response time over the time interval midnight on the start date to 11:59 PM on the end date.
- Fixed Response Time – The response time entered in this field will become the response time against which your current response times on the enterprise overview page will be compared.
- Baseline Definitions – The method to be used for
determining the response time baseline.
- Click Save.
These properties are actually defined at the group level for the servers once they are added to a group. The group properties take precedence over the system properties. When the response time reaches Indicator 1, an orange indicator will display on the Enterprise Overview page; a red indicator means the response time has exceeded Indicator 2.
Tweak the SNMP Network
Use the SNMP Network settings to indicate the configuration for the SNMP server. A test message will be sent to the SNMP Network Manager to test for connectivity.
To configure the SNMP Network:
- From the top navigation, click Administration
> Managing Server > System Properties.
The System Properties page opens.
- On the left navigation, click SNMP. The
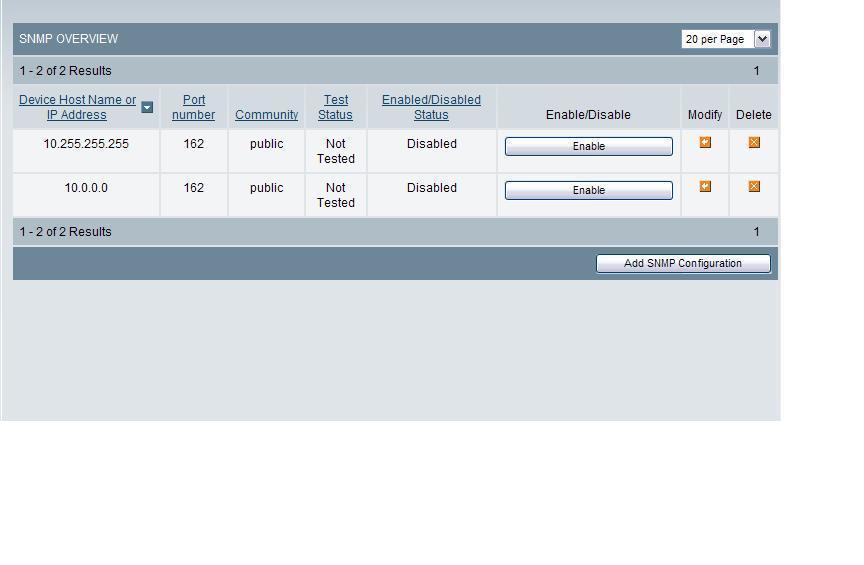
SNMP Overview page opens. This page displays details of existing SNMP
configurations:
Figure 5. SNMP Network Configuration
- Click Add SNMP Configuration, the SNMP Network Configuration page
opens:
Figure 6. SNMP Network Configuration
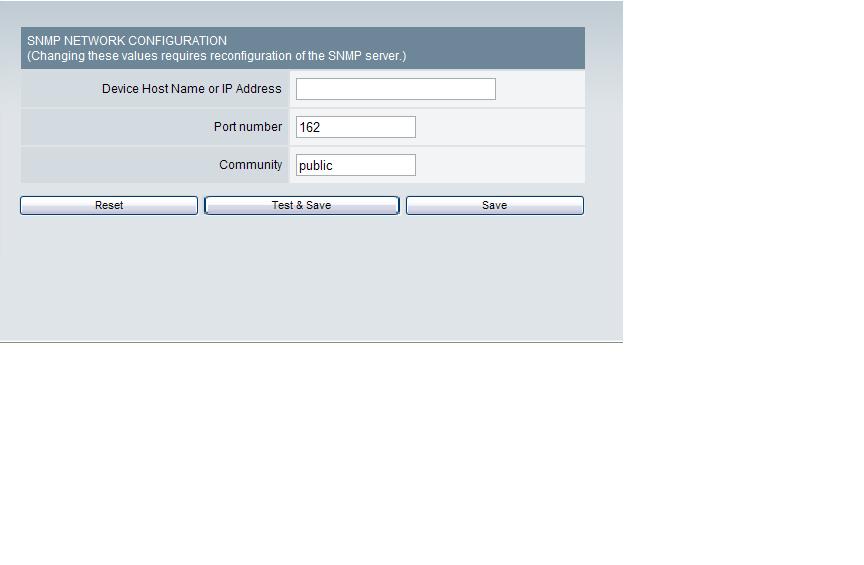
- Enter the appropriate value for the following properties:
Device Host Name or IP Address – The name or address of the SNMP Network Manager, to which SNMP messages will be sent.
Port Number – The port number of the SNMP Network Manager.
Community – A string that is part of the SNMP protocol.
- Click Test & Save to send a test message to the SNMP Network Manager and to save the settings.
- Click Save to save the settings.
Self-Diagnosis
This section is designed for the Support staff to service ITCAM for WebSphere and J2EE. The Self-Diagnosis provides a view of all the components currently running, their states and attributes. ITCAM for WebSphere and J2EE consists of the following components:
- kernel
- data collector controller
- publish server
- global publish server
- message dispatcher
- polling agent
- archive agent

Since ITCAM for WebSphere and J2EE is designed to run in a loosely-coupled, dynamic environment, individual components can be up or down without affecting the integrity of the whole system.
View the Self-Diagnosis for the kernel
The kernel is a directory service dedicated to ITCAM for WebSphere and J2EE that monitors the components that join and leave the network. The Self-Diagnosis provides a view of all the components on the kernel currently running and their attributes.
To view the Self-Diagnosis for the kernel:
- From the top navigation, click Administration > Managing Server > Self-Diagnosis.
The Self-Diagnosis page opens displaying the kernel's data.
- From the left navigation, click the + Kernel Instances.
- Click to select the kernel link you want to view. The kernel runtime environment details are displayed.
View the Self-Diagnosis for the archive agent
The archive agent collects data from the publish server and archives it into the database for reporting. The Self-Diagnosis provides a view of the archive agent's attributes, as well as all the components with which the archive agent has relationships.
To view the Self-Diagnosis for the archive agent:
- From the top navigation, click Administration > Managing Server > Self-Diagnosis.
The Self-Diagnosis page opens.
- From the left navigation, click the + Archive Agents.
- Click to select the archive agent you want to view. The data for the selected archive agent displays.
View the Self-Diagnosis for the publish server
The publish server receives data from the data collector and aggregates it based on different needs. The Self-Diagnosis provides a view of the Publish Server's attributes, as well as all the components with which the publish server has relationships.
To view the Self-Diagnosis for the publish server:
- From the top navigation, click Administration > Managing Server > Self-Diagnosis.
The Self-Diagnosis page opens.
- From the left navigation, click the + Publish Servers.
- Click to select the publish server you want to view. The data for the selected publish server displays.
View the Self-Diagnosis for the global publish server
The global publish server keeps track of composite requests, as they move from one server to another. The Self-Diagnosis provides a view of the global publish server's attributes, as well as all the components with which the global publish server has relationships.
To view the Self-Diagnosis for the global publish server:
- From the top navigation, click Administration > Managing Server > Self-Diagnosis.
The Self-Diagnosis page opens.
- From the left navigation, click the + Global Publish Servers.
- Click to select the global publish server you want to view. The data for the selected global publish server displays.
View the Self-Diagnosis for the data collector controller
The data collector controller is the part of a data collector that regulates the behavior of a data collector, including the monitoring level, filter list, and enable or disable status. The Self-Diagnosis provides a view of the data collector's attributes, as well as all the components with which the data collector has relationships.
To view the Self-Diagnosis for the data collector controller:
- From the top navigation, click Administration > Managing Server > Self-Diagnosis.
The Self-Diagnosis page opens.
- From the left navigation, click the Data Collector Controller link.
- Click to select the data collectors you want to view.
The data for the selected data collector controller displays.
View the Self-Diagnosis for the message dispatcher
The message dispatcher sends out e-mails of performance reports and trap actions from the Performance Analysis and Reporting and the Trap and Alert Management features. The Self-Diagnosis shows all the attributes of the message dispatcher, such as total number of e-mails sent.
To view the Self-Diagnosis for the message dispatcher:
- From the top navigation, click Administration > Managing Server > Self-Diagnosis.
The Self-Diagnosis page opens.
- From the left navigation, click the + Message Dispatchers.
- Click to select the message dispatcher link you want to view. The message dispatcher runtime environment details are displayed.
View the Self-Diagnosis for the polling agent
The polling agent maintains the list of Web servers monitored by ITCAM for WebSphere and J2EE. The Self-Diagnosis provides a view of the polling agent's attributes, as well as all the components with the polling agent has a relationship.
The Polling Agent is only available in ITCAM for WebSphere Basic.
To view the Self-Diagnosis for the polling agent:
- From the top navigation, click Administration > Managing Server > Self-Diagnosis.
The Self-Diagnosis page opens.
- From the left navigation, click the + Polling Agents.
- Click to select the polling agent you want to view. The data for the selected polling agent displays.
Monitor on Demand
Purpose
Monitor on Demand (MOD) enables you to create a schedule and respond to problems by defining the level of monitoring.
Usage Overview
- Set the level of monitoring best suited for the servers at a given time.
- Create schedules to automatically change the monitoring level for the servers.
User Scenarios
Scenario 1: Setting a schedule for detailed monitoring at night
Your manager wants you to monitor the servers at Level 3 during off hours because that's when the load is the lightest. As the ITCAM for WebSphere and J2EE administrator, you set a schedule to monitor the servers during business hours at Level 1 and at night at Level 3.
Scenario 2: Overriding the monitoring level during an emergency
An emergency arises that requires Level 3 monitoring to locate a problem. As the ITCAM for WebSphere and J2EE administrator, you override the current schedule and set the monitoring level to Level 3. After fixing the problem, you can reset the monitoring level or wait until the next schedule change.
Monitor levels
The following describe the different monitoring levels available:
- L1 (Production mode) - this monitoring level provides availability management, system resources and basic request-level data. This monitoring level least affects the CPU overhead per transaction and is appropriate for servers that are not malfunctioning.
- L2 (Problem determination mode) - this monitoring level provides production level monitoring plus advanced request data, including external component and CPU information, as well as additional monitoring fields and functions. Under problem determination mode you can view component traces. These are traces that show J2EE request-related events, for example, EJB, JDBC, JNDI, JMS. Use this level when you suspect a problem or need to capture data about external events but do not need all the method-level data. When you select L2, you will be given the option to check MP for Method Profiling. This feature enables you to determine how often the data collector will aggregate method data and send the data to the managing serve: 1-999 minutes. You can view the method profile reports on the Method Profiling Management page.
- L3 (Tracing mode) - this is the most powerful monitoring level, therefore only this level utilizes all reporting elements available. This level monitors everything in L2 plus method and SQL-call level operations. For example, in L3 the server activity display shows additional data for the following columns: Accumulated CPU, Last Known Class Name, Last Known Method, and Last Known action. In addition, on the Request Detail page, the method trace with SQL statements are also available. L3 has inherently higher overhead than the other monitoring levels. Therefore, use this level for servers that have been selected for diagnostics and detailed workload characterization. Trap and Alert functions that are based on L3 events require set Data Collectors on L3.
The ITCAM for WebSphere and J2EE default settings are tuned to handle L1 and L2 tracing. When you select L3, additional tuning is necessary so that ITCAM for WebSphere and J2EE can handle the large amount of data generated by the trace.
See on tuning, see the Data Collector Installation and Customization guide.
You must be in either Problem Determination Mode (L2) or Tracing Mode (L3) to retrieve information about lock contentions and lock acquisitions.
Systems Overview
Purpose
Systems Overview enables you to evaluate the availability of the entire system by looking at recent performance trends.
Usage Overview
This feature helps you:
- Monitor the enterprise's availability.
- View dashboards of Enterprise, Server Group, Server and Portal.
- Quickly isolate deviations from baseline response time thresholds.
- Monitor both server availability and application availability.
- Isolate problematic servers.
- Drill down to the problematic server group or server.
- Identify problematic resources on individual servers.
- Easily jump to other relevant product features to continue isolating problems.
User Scenarios
Scenario 1: Verifying customer response time complaints
Customer service has been receiving complaints that the company's Web sites have been responding slowly. As one of the administrators of the servers, the inquiry has come to the attention. Upon opening the Enterprise Overview page, you immediately see that three of the production servers are no longer available. You also verify that the response time has degraded.
Scenario 2: Diagnosing an application problem
Customers have been complaining that they cannot place orders. As one of the company's administrators, you go to the Enterprise Overview page and see that all the servers are up. You find the group that appears to have the highest response time and drill down to the Server Overview page where you see that a database connection pool is saturated.
View Server Statistics Overview
Purpose
The Server Statistics Overview helps you compare activity and related platform data across servers so that you can recognize problems. By default, the data on Server Statistics Overview page refreshes every 60 seconds.
Usage Overview
This feature helps you:
- Assess activity on servers and platforms.
- Set visual alerts to appear on the screen when resources pass what you determine an acceptable threshold.
- Easily jump to other relevant product features to continue isolating problems.
User Scenarios
Scenario 1: Investigating an unresponsive system
Your first line of support receives calls that some parts of the system are not responding. The support team goes to the Server Statistics Overview page and immediately sees that one server displays the red icon representing the “unavailable” status. The support team determines the unavailable server needs to be restarted, which will return the system to full functionality.
Scenario 2: Monitoring proactively
As the administrator of production systems, you have set appropriate thresholds for the fields displayed on the Server Statistics Overview page. During the regular monitoring you see that the Paging Rate threshold is being crossed. You know that the increase in paging rate probably means an increase in overhead. You can now increase memory, add servers, or take some similar course of action to keep production running smoothly.
In-Flight Request Search
Purpose
Use In-flight Request Search to improve the chances of locating a malfunctioning application in the server farm. In-flight Request Search provides a snapshot of the transactions in progress, showing you hanging transactions.
Usage Overview
This feature helps you:
- Locate hanging transactions.
- Search for a specific transaction that you suspect is in progress.
- Search for a transaction on a specific server or across multiple servers.
- Pinpoint specific transaction details.
- Obtain additional information, such as a Stack Trace, Method Trace, or Session objects for suspicious transactions.
- Fix a hanging request by canceling it or changing its priority.
- Discover the relationships that a hanging request has with other requests, running on other appservers, in a composite transaction that spans multiple appservers.
- Easily jump to other relevant product features to continue isolating problems.
User Scenarios
Scenario 1: Investigating a hanging transaction
Customers call and complain they are having trouble completing transactions. You go to In-flight Request Search to locate a hanging transaction and, upon finding one, view a method trace for the transaction. You can see that the transaction is waiting for the return of a specific SQL call. You forward the method trace to a database administrator for further analysis.
Scenario 2: Isolating a problem with CPU utilization
After looking at the Server Statistics Overview page, you notice that CPU utilization is very high. You go to the In-flight Request Search to see if a transaction is present. It appears the system is churning on a transaction. Through a method trace, you suspect the transaction is looping. You forward the method trace to a developer for further analysis.
Server Activity Display
Purpose
The Server Activity Display helps you troubleshoot and fix hanging requests and evaluate the current performance of the applications.
Usage Overview
This feature helps you:
- Identify hanging requests.
- Fix a hanging request by canceling it or changing its priority.
- Isolate the particular method(s) or component(s) that cause a request to hang.
- Discover the relationships that a hanging request has with other requests, running on other appservers, in a composite transaction that spans multiple appservers.
- Get a flavor of what the most recently completed requests on a server were, along with their vital statistics.
User Scenarios
Scenario 1: Troubleshooting an application that hangs.
Several users of application Z have reported that they can't update their user preferences: Application Z times out after a minute of not responding. You look for the application Z requests that have long resident times in the Active Requests tab of the Server Activity Display. View the Request Detail for one of these requests to determine why or where it is hanging.
Scenario 2: Understanding immediate workload.
While performing normal monitoring of the servers, you notice that a server's average response time has recently increased, with no appreciable change in throughput. You begin by looking at the Recent Requests tab of the Server Activity Display to see what the most recently completed requests have been on that server. You can see whether the requests are uniformly slow, or if there is variation among requests; this may help you isolate whether it is a problem with the server (uniformly slow), or with an application (certain requests are slow). You can see whether the slow requests are CPU-heavy, or if they are spending too many moments idle.
Recent Activity Display
Purpose
Use Recent Activity to discover problems related to memory or other resources.
Usage Overview
This feature helps you:
- Identify JVM-related issues.
- Recognize when memory-related problems are compromising other parts of the system or other resources.
- Identify which resource is limiting recent performance.
User Scenarios
Scenario 1: Evaluating the impact of garbage collection
You suspect that frequent garbage collection calls are affecting the performance of a server, so you go into Recent Activity and set up the first graph to display the Number of Garbage Collections metric for the last 48 hours. In the second graph, you roll through the different metrics possibly affected by frequent garbage collection.
The Garbage Collection option is not supported for either CICS or IMS.
Memory Diagnosis
Purpose
Gain insight into the JVM's heap and memory information through Memory Diagnosis. Use this information to tune the JVM parameters, assess the resources, and find evidence of memory leaks.
Usage Overview
This feature helps you:
- View an analysis of the heap and make adjustments to the JVM parameters based on the findings.
- Evaluate the resources being used by the system and make capacity planning decisions.
- Uncover memory leaks and find the classes that are memory leak candidates.
User Scenarios
Scenario 1: Detecting a memory leak
After creating a Memory Analysis report that compares JVM Heap Size to Average Response Time, you think there is a memory leak. Access the Memory Leak feature to see if the amount of uncollected memory is increasing. You set up a candidate for the server in question. This tells the system to collect heap data now and again after a specified amount of time. Then you can compare the heap data for the two periods of time to determine if there is evidence of a memory leak.
Scenario 2: Supporting the claim that the purchase of new servers is necessary
The year end budget is due and we need to project whether you will need to buy more servers for the environment. You create a Memory Analysis report during peak usage and compare JVM Heap Size to the Number of Sessions. The number of servers is close to maxing out the current environment. As a capacity planner, you recommend that the company increase the number of servers currently servicing the environment.
JVM Thread Display
Purpose
Use the JVM Thread Display to view all threads running within an application server's JVM.
Usage Overview
This feature helps you:
- View hanging processes in the application server.
- Change the priority or obtain a stack trace of an active thread.
- View a thread dump.
User Scenarios
Scenario 1: How to alleviate high server response time
You are asked to investigate server A where response time and JVM CPU% are higher than expected, but throughput is normal. You don't see any active requests in the In-flight Request Search, so you suspect there may be threads running outside the application server. You access the JVM Thread Display and notice a couple of suspect threads. After taking a thread dump for the JVM, find the details of the current thread that is misbehaving and either re-prioritize or cancel the thread.
Software Consistency Check
Purpose
Use the Software Consistency Check to troubleshoot aberrant servers in an otherwise homogenous server group.
Usage Overview
This feature helps you:
- Detect mismatches in software in a “clone” environment.
- Compare a properly functioning server with other servers in the server farm.
User Scenarios
Scenario 1: Comparing a non-functioning server with working servers
After an upgrade to Application B, which is deployed on multiple servers, requests on Server D are occasionally hanging while all the other servers are working fine. As an Operator, you check the Runtime Environment and compare the server having problems with one of the properly functioning servers. Go to the Installed Binary Check to see if the files on both servers are the same. You find that one of the files on Server D is not the same as the file on the server that is properly functioning. Install the proper file to correct the problem.
Trap and Alert Management
Purpose
Use Trap and Alert Management to monitor server health and determine problems with applications.
Prevent disruptions in service by receiving alerts before problems arise. Gather data that helps you pinpoint the root cause of difficult-to-reproduce problems.
Usage Overview
This feature helps you:
- Monitor a group of servers or a selected server.
- Find out immediately when servers, applications, components, or methods are not healthy, and obtain the data necessary for diagnosis.
The following Application Traps are available:
- Occurrence - The number of times the specified unit occurred.
- CPU Time - The amount of time the CPU is executing instructions.
- Wait Time - The amount of time the CPU is idle.
- Resident Time - In-flight - Based on the resident in-flight time of a transaction, the Publish Server keeps track of all the active (in-flight) requests and their resident times and triggers the trap if the resident time of the request exceeds the time configured in the trap condition.
- Resident Time - Completed - The wall clock time for when the unit of a transaction, method, etc. ends, minus the wall clock time when it started.
- Resident Time - Misbehaving Transaction -
With this target type, when the complete response request time violates
the threshold in the trap definition, the monitoring level for the
request switches from L1/L2 to L3 and component/method trace detail
is captured. As switching from L1/L2 to L3 has a performance impact
on the Data Collector, there are 2 fields you can use to deactivate
the trap and return to the original L1/L2 monitoring level once the
required detail has been captured:
- Number of occurrences of every request after which the trap will be deactivated - The purpose of this field is to prevent the Data Collector from running at L3 indefinitely. The value in this field determines the number of times you want every request to reach the threshold before the trap is deactivated. Using this field enables you to capture component/method trace detail at L3 when the threshold is exceeded, and to then automatically revert to the original monitoring level, thereby reducing the performance cost to the server.
- Number of occurrences of every request that doesn't violate this
trap after which mod level is reverted back and trap is deactivated
- Once L3 is enabled, after the trap condition is violated the first
time, it remains at L3 until the request violates for the predetermined
number of times as set in the Number of occurrences of every request
after which the trap will be deactivated field. As a result, the request
in the Data Collector will remain at L3 if the request doesn't
violate for the predetermined number of times, resulting in performance
cost to the Data Collector. To prevent this, use this field - Number
of occurrences of every request that doesn't violate this trap after
which mod level is reverted back and trap is deactivated .
Once the trap triggers and the monitoring level switches to L3, if the number of requests that does not reach the threshold is equal to the value in this field, then the trap is deactivated.
- Uncaught Exceptions - Capture exceptions that occur in applications and data about the failure.
- Lock Acquisition Time - In-flight - The in-flight transaction has not completed and may be hanging, using this type will provide data on how to fix the problem. What is being measured is the amount of time taken to obtain an acquisition. The acquisition clock starts when the class/method begins trying to acquire the lock, and ends when the lock is acquired.
- Lock Acquisition Time - Completed - The amount of time taken to obtain an acquisition. The acquisition clock starts when the class/method begins trying to acquire the lock, and ends when the lock is acquired.
The following Server Resource Traps are available:
- CPU: Average Platform CPU % Usage - Based on the average platform CPU usage over five minutes, the Publish Server retrieves CPU usage at regular intervals (60 seconds by default) and calculates the average platform CPU over five minutes.
- CPU: Average JVM CPU % Usage - Based on the average JVM CPU usage over five minutes, the Publish Server retrieves CPU usage at regular intervals (60 seconds by default) and calculates the average JVM CPU over five minutes.
- Memory: JVM Heap Size - Based on the JVM Heap Size of the data collector, the Publish Server retrieves JVM Heap Size from the data collector at regular intervals (60 seconds by default) and checks the heap size from that measure.
- Memory: Garbage Collection Frequency - Garbage Collection is calculated over one minute (supported in ITCAM for WebSphere Data Collector and ITCAM for J2EE WebLogic Data Collector).
- Memory: Average JVM Heap Size after Garbage Collection - The trap triggers when the average JVM Heap size exceeds the size configured in the trap (supported in ITCAM for WebSphere Data Collector and ITCAM for J2EE WebLogic Data Collector)
- Application Capacity: Number of Sessions - Based on the number of user sessions that are currently in use by the application server.
- Application Capacity: Average Response Time - Publish Server triggers the trap if the average response time exceeds the time configured in the trap condition (supported in ITCAM for WebSphere Data Collector and ITCAM for J2EE WebLogic Data Collector).
- Application Capacity: Server available -
The Publish server triggers the trap when the Server (Data Collector) becomes available.
- Application Capacity: Server unavailable -
The Publish server triggers the trap if the Server (Data Collector) goes down or becomes unavailable (supported in ITCAM for WebSphere Data Collector and ITCAM for J2EE WebLogic Data Collector).
- Application Capacity: Uncaught Java Exceptions - Based on the rate of the Java exceptions that occur in applications and includes data about the failure. It is calculated over 60 seconds. Publish server triggers the trap if the Servlet error rates exceed the number configured in the trap condition.
- Application Capacity: Request Frequency - Number of requests per minute.
- Resource Pool: Thread Pool % Usage - Publish Server triggers the trap if the Thread Pool % Usage of a particular server exceeds the threshold that is specified in the trap condition (supported in ITCAM for WebSphere Data Collector and ITCAM for J2EE WebLogic Data Collector).
- Resource Pool: JCA Pool % Usage - Publish Server triggers the trap if the JCA Pool % Usage of a particular server exceeds the threshold that is specified in the trap condition (supported in ITCAM for WebSphere Data Collector and ITCAM for J2EE WebLogic Data Collector).
- Resource Pool: JDBC Pool % Usage - Publish Server triggers the trap if the JDBC Pool % Usage of a particular server exceeds the threshold that is specified in the trap condition (supported in ITCAM for WebSphere Data Collector and ITCAM for J2EE WebLogic Data Collector).
User Scenario
Scenario 1: Debugging complex applications
You are monitoring application A, which has a J2EE component on server S and a legacy CRM back end. The Java component of application A frequently exhibits idle times of several seconds, even when there is not much load on server S. You do not wish to run at L3, but you want to see in what methods the Java application is waiting. You set an Application Trap for Wait Time with a Threshold of 2,000 ms, by Request for application A, choose the Stack Trace Data Action and apply this trap to server S. The next time a request for application A takes longer than two seconds, the system will take a stack trace of server S. Look in the Trap Action History to obtain the stack trace, to determine where application A is waiting.
System Resources
Purpose
System Resources helps you tune the appservers.
Usage Overview
This feature helps you:
- Find bottlenecks in application server resources.
- Database Connection Pools
- Thread Pools
- JCA Connection Pools
- Gather the information we need in order to tune an application server's managed resources.
- Understand the internals of an application server and how they
are utilized by the workload:
- Servlet
- JVM
- J2EE Domain
- J2EE Server
- J2EE Application
- EJB Module
- Web Module
- RAR Module
- EJB Entity Bean
- EJB Stateful Session Bean
- EJB Stateless Session Bean
- EJB Message Driven Bean
- Resource Adapter
- JDBC Resource
- JDBC Data Source
- JDBC Driver
- JCA Resource
- JMS Resource
- JTA Resource
- RMI IIOP Resource
- Thread Pool
- ORB
- Dynamic Cache
- Servlet Session Manager
- Transaction Services
- High Availability Manager Module
- System Module
- J2C Module
- Web Services Module
- Workload Manager Module
- Web Service Gateway Module
- Object Pool Module
- Alarm Manager Module
- Scheduler Module
- DCS Module
- SQL
- JCA-CICS
- MQI
This list is from WebSphere JMX and PMI categories. Different application servers might provide different JMX data.
User Scenarios
Scenario 1: Eliminating bottlenecks
The response time of application A becomes unacceptable once the server is experiencing modest throughput. You see that much of the resident time is spent idle. To see if the cause is a bottleneck in the application server pools, use System Resources during these times to view the percentage of threads used in the Database Connection Pools, Thread Pools, and JCA Connection Pools. If any pool is at or near 100%, it is likely that demand for application A is saturating those resources. You may be able to fix the problem by creating more or larger pools.
Performance Analysis and Reporting
Purpose
Use Performance Analysis and Reporting to analyze historical data.
This helps you understand the performance of the applications and the utilization of the servers.
Usage Overview
This feature helps you:
- Isolate performance bottlenecks.
- Find problematic method calls by drilling down from high level trends to detailed traces.
- Use top reports to identify the “hot spots” in the application.
- Understand the behavior of the transactions by decomposing the transaction into different parts.
- Identify slow transactions, SQL, or MQI calls.
- Understand where time is spent in composite transactions that span multiple appservers.
- Tune the application server.
- View server resource trends so that you can tune the application server accordingly.
- Predict the server capacity.
- Identify peak usage and usage patterns.
- Decompose the workload that is being driven against the server.
- Predict the capacity of the servers against various types of demands.
- View the server's availability.
- Produce SLA information for you and the management.
- Manage the reports.
- Schedule reports to show up in the e-mail daily.
- Perform further analysis offline by exporting reports into PDF or CSV formats.
- E-mail the findings to the colleagues.
User Scenarios
Scenario 1: Investigating poor response time claims
Customers have been complaining about poor performance on Application A. As a performance analyst, you go into ITCAM for WebSphere and J2EE and draw up a response Trend Report for Application A for the last week to verify the customers' claims. Once you are able to see that there indeed are instances of poor response time, you decompose the problematic period to see how different requests impact the response time. Drill down to a method trace of an actual instance of a slow transaction, and e-mail this Trace Report to the developers so they can determine why the transaction was slow.
Scenario 2: Predicting how the servers will handle a new workload
Marketing is going to launch a new campaign to bring more visitors to the site. Your manager wants to make sure that there is enough capacity to handle the projected workload without degrading response times. As a capacity planner, we need to project how well the current servers will perform under the new workload. You create a Capacity Analysis report to compare throughput versus response time. You can use the trend line to estimate at what throughput the response time will be unacceptable.
Composite requests
Your ITCAM for WebSphere and J2EE administrator must enable composite request support for all data collectors that participate in composite requests.
PDF generation is inactive until the site completes the iText integration instructions in Appendix K of the IBM Tivoli Composite Application Manager: Managing Server Installation and Customization Guide.
Purpose
Use Composite Request features to monitor transactions that utilize resources on more than one server.
Usage Overview
These features help you:
- Determine whether the reason a top-level request hangs is its use of resources on a different application server.
- Identify the origin (the application server and top-level request) that invoked a hanging request.
- Discover the inter-application architecture of complex workflows.
User Scenarios
Scenario 1: Discovering application architecture
Your manager asks you to provide an example of a complete transaction of an airline reservation application. This involves a Web-based Java application, a CICS credit card processing application, a CICS ticket reservation application, and a frequent-flyer account, which is also a CICS system.
You look in Performance Analysis and Reporting for examples of the airline reservation application, some of which will have the composite request indicator. Clicking on the indicator brings you to the composite request view of the Method Trace, which lets you navigate among these requests, so you can see which application calls which one, and by what mechanism (MQ, CTG, or DPL). You can e-mail PDFs of each request involved in the composite transaction to the manager.
Product Overview
ITCAM for WebSphere and J2EE and composite requests
One aspect of ITCAM for WebSphere and J2EE is its ability to show individual requests/transactions. The benefit of Composite Requests is to identify individual requests/transactions that are related.
Finding composite requests: ITCAM for WebSphere and J2EE
In particular, the Composite Request Indicators appear in the following four sections of ITCAM for WebSphere and J2EE:
- Server Activity Display—View active requests/transactions on a specific server.
- In-Flight Request Search—Search for active requests/transactions on all servers, a group of servers, or a specific server.
- Performance Analysis and Reporting: Detail Reports derived from Request/Transaction Analysis Trend Reports—View the requests/transactions that comprise the Decomposition report.
- Request Detail—View the details of a request/transaction, and provide controls for changing its status (if it is an active request/transaction).
View composite requests
Furthermore you can investigate composite requests in more detail through the following features:
- Composite Method Trace—Display the method traces of all requests/transactions in the composite request.
- Composite Stack Trace—Display the stack traces of all servers involved in the composite request that are still actively processing the request/transaction.
These features are described in detail in this chapter.
The scope of composite requests
To understand the scope of what ITCAM for WebSphere and J2EE can monitor, and how ITCAM for WebSphere and J2EE fits in, we introduce two terms: managed space and composite request space.
- Managed space is the term we use to describe the entire scope of what ITCAM for WebSphere and J2EE can monitor. Since ITCAM for WebSphere and J2EE can monitor servers and appservers, along with applications and J2EE components like EJBs, the Managed space has many dimensions.
- Composite request space is the term we use to describe a subset of the Managed space. Generally speaking, composite requests are those requests that conform to an Enterprise Application Integration (EAI) architecture, which is to say, requests for Web-enabled legacy applications.
Both of these terms are described in more detail, following a review of the ITCAM for WebSphere and J2EE architecture.
ITCAM for WebSphere and J2EE architecture: the context of the managed space
The basic model of ITCAM for WebSphere and J2EE is to have a single managing server and many data collectors.
The data collectors are dynamically controlled through the managing server, in terms of what data to collect, and the data collectors deliver their collected data to the managing server.
The managing server is the heart and brain of ITCAM for WebSphere and J2EE. It is the entity to which each of the many data collectors communicate, and provides the ITCAM for WebSphere and J2EE User Interface.
The data collectors are the eyes and ears of ITCAM for WebSphere and J2EE. For each Application Server being monitored, a data collector is deployed on the computer hosting the application server. (If a server has two appservers, then configure two data collectors on the server in order to monitor both appservers.)
What does it mean to be managed?
Based on the preceding explanation of the ITCAM for WebSphere and J2EE architecture, we can describe in detail what is in the managed space.
Servers
Since ITCAM for WebSphere and J2EE data collectors obtain platform-level data, any server on which a data collector is installed will be in the managed space. For z/OS systems, a server is considered to be equivalent to an LPAR.
Application Servers
Since ITCAM for WebSphere and J2EE data collectors obtain application server-level information, any application server running in a JVM in which a data collector is configured will be in the managed space. CICS and IMS regions are considered to be appservers.
The architecture of WebSphere running on z/OS consists of a single application server definition and one or more application server regions.
The definition and the regions, taken as a whole, are called an application server instance. What ITCAM for WebSphere and J2EE considers to be the application server depends on the context: In a few cases, the application server is either the entire application server instance (as in the case of MOD schedules), but in most cases, the application server is an individual application server region.
Resources
ITCAM for WebSphere and J2EE monitors common resources that are made available through the application server and the J2EE APIs, such as EJB, JMS, JNDI, JDBC, and JCA. If an application server is in the managed space, then the resources it provides are also in the managed space.
Applications
ITCAM for WebSphere and J2EE supports monitoring of any application which is served by an application server. If the application server is in the managed space, then the applications it serves will be in the managed space. As a corollary, standalone applications, which are not served through an application server, are not in the managed space.
Define the composite request space
Given an understanding of the ITCAM for WebSphere and J2EE managed space, we can now describe the subset of it covered by composite requests.
Although the managed space includes servers, appservers, requests and resources, the composite request space covers only requests, and only a subset of those requests in the managed space.
It is necessary to discuss Enterprise Application Integration (EAI) architecture, in order to clearly describe how requests interact and to define the composite request space.
Enterprise Application Integration
The fundamental notion of Enterprise Application Integration (EAI) is to make a legacy system accessible through the Web. From the J2EE perspective, this means that an initial request, served by a J2EE application server, invokes a resource on a legacy system through the JCA API.
EAI transaction terminology
When describing EAI transactions, the name we use for the initial J2EE request is the Home Request, and its server is called the Home Server. We call the legacy transaction a Participating Request, and its server is called a Participating Server. There may be more than one Participating Request if the legacy resource invokes resources on other legacy systems.
EAI transaction in the managed space
The first thing to note is that, if the legacy system is CICS , and a CICS data collector has been installed, then the legacy system will be within the managed space. Similarly, if the legacy system is IMS, and an IMS data collector has been installed, then the legacy system will be within the managed space. The J2EE application server will be within the managed space if its data collector is installed.
This means that, as part of normal ITCAM for WebSphere and J2EE operations, both the Home Request and the Participating Requests appear in ITCAM for WebSphere and J2EE. However, without the composite request enhancement, these requests appear independently, and there is not explicit indication that they are part of the same transaction.
Not only does the composite request enhancement make this relationship explicit, it also provides diagnostic tools, like Method Trace and Stack Trace, that you can apply across all requests in the composite request.
Monitor CICS transactions
The CICS data collector monitors all program invocations on the managed CICS region, whether they come through a dumb terminal, Distributed Program Link (DPL), EXEC CICS START, or through the CICS Transaction Gateway (CTG).
Furthermore, for transactions invoked through CTG, it does not matter how CTG was accessed, which can include a variety of interfaces.
However, ITCAM for WebSphere and J2EE will not track all such transactions as composite requests.
CICS and IMS transactions in composite requests
Even though all transactions on a CICS or IMS region in the managed space will appear in ITCAM for WebSphere and J2EE, they will not necessarily be treated as part of a composite request, even if they invoke programs on other regions.
A transaction on a CICS or IMS region will be part of a composite request if it meets the following criteria:
- The CICS or IMS region is in the managed space.
- The Home Server is in the managed space.
- The application server that serves the Home Request is a J2EE application server, and is in the managed space.
- For CICS: The application on the Home Server uses ECI to access CTG. (This includes applications that use CCI as their JCA resource adapter, since CCI uses ECI.)
- The ECI invocation is synchronous.
- The COMMAREA of the CICS program invocation has at least 11 bytes of available space.
- For IMS: The application on the Home Server uses ICHJ to access IMS connect.
If any of these criteria are not met for an EAI request, then ITCAM for WebSphere and J2EE will not identify the request as being part of a composite request. However, the core ITCAM for WebSphere and J2EE features will still be available for whatever parts of the transaction are in the managed space.
For example, if an application in C++ invokes a CICS program on a CICS region in the managed space, through CTG, the CICS program will appear as a request within ITCAM for WebSphere and J2EE, but the C++ application request will not appear within ITCAM for WebSphere and J2EE, since ITCAM for WebSphere and J2EE does not monitor C++ applications. In this case, ITCAM for WebSphere and J2EE will not identify the CICS transaction as part of a composite request.
Likewise, if a Java application uses EPI to access CTG, ITCAM for WebSphere and J2EE will not track the EAI as a composite request, even if the application is in the managed space. In this case, the requests on both the J2EE application server and in the CICS region will appear in ITCAM for WebSphere and J2EE, but will appear independently, and will not be identified as a composite request.
The final condition, based on the application's use of the COMMAREA, is due to the methodology of tracking composite requests, which involves use of the COMMAREA. In practice, it is rare that program invocations use so much of the COMMAREA that there isn't room for this correlation information. In these exceptional cases, ITCAM for WebSphere and J2EE does not attempt to identify the EAI as a composite request, and the individual requests appear in ITCAM for WebSphere and J2EE as independent requests.
Multiple hops
Composite requests are not restricted to single-hop transactions.
In particular, composite requests include cases where CICS programs make DPL calls to other CICS Regions. When such a call is made, we say that the depth of the composite request increases. ITCAM for WebSphere and J2EE can track requests with no limit to the depth of transaction "hops."
For IMS, any events with the same message tag from any IMS region within anIMS Network appear as a single transaction.
In addition, composite requests can include up to 100 Participating Requests made directly by each Home or Participating Request. Although composite requests can include an unlimited depth of "hops," composite requests place a limit on the number of trackable calls made by any single request.
Tweak data collectors that use MQ
If we are monitoring composite requests for applications that use MQ as a mechanism to bridge J2EE and CICS or IMS, then configure each participating data collector to monitor MQ.
These instructions assume the data collectors have already been configured.
To enable MQ monitoring on a data collector within the Application Monitor:
- Open the Application Monitor.
- Click the Administration tab on the top navigation.
- Select Server Management > Data Collector Configuration.
- Follow the Configuration Library link in the left navigation.
- Locate the application server in the Associated Server column of the Configuration Library table and click the Modify icon for that row.
- Check the Enable MQ check box (if it is not already checked.)
- Fill in the Exclude (Queue) and Exclude Override (Queue) lists to specify which queues you want to monitor.
- Click the Save button.
Finding composite requests
To find composite requests, you can use features of ITCAM for WebSphere and J2EE to locate participating requests/transactions. Requests/transactions that participate in a composite request are distinguished from single-server requests/transactions by the Composite Request Indicator.
This section describes how to find composite requests in ITCAM for WebSphere and J2EE. The subsequent chapters describe the composite request features in detail.
Identifying composite requests in ITCAM for WebSphere and J2EE
The Composite Request Indicator
There are three ways to locate requests/transactions within ITCAM for WebSphere and J2EE. Two features help you locate active requests/transactions:
- In-Flight Request Search
- Server Activity Display
A third feature helps you locate completed requests/transactions:
- Performance Analysis and Reporting
Each of these features produces a list of requests/transactions which may participate in a composite request. The presence of the following icon indicates that a request/transaction participates in a composite request:
Figure 7. The Composite Request Indicator
Use the Composite Request Indicator
This section describes how to find requests/transactions that participate in composite requests, by looking for the Composite Request Indicator in the following ITCAM for WebSphere and J2EE features:
- In-Flight Request Search
- Server Activity Display
- Performance Analysis and Reporting
In-Flight Request Search
To search for in-flight requests/transactions that participate in composite requests, use the In-Flight Request Search.
Enter in the search argument and, if we like, restrict the search to a group of servers or a particular server. In-Flight Request Search displays a list of the active requests/transactions that contain the search string on the servers you specified.
In addition to the normal output (which includes the Server Name, Client Request/Transaction, Start Date Time, Thread ID, and Total Resident Time), ITCAM for WebSphere and J2EE identifies those requests/transactions that are part of a composite request by displaying the Composite Request Indicator.
Server Activity Display
To search a server for resident requests/transactions that participate in composite requests, use the Server Activity Display.
Once you select a server, Server Activity Display displays a list of the active requests/transactions on that server (in the Threads section of the page).
In addition to the normal output (which includes the Client Requests, Client Requests Start, Thread ID, Resident Time, Accumulated CPU, Idle Time, Thread Status, Last Known Class, Last Known Method, Last Known Action, and User ID), ITCAM for WebSphere and J2EE identifies those requests/transactions that are part of a composite request by displaying the Composite Request Indicator.
Performance Analysis and Reporting
To search for completed requests/transactions that participated in composite requests, use Performance Analysis and Reporting. You must start with a Trend Report, drill down to a Decomposition Report, and then to a Detail report in order to find individual requests/transactions that are part of composite requests.
Performance Analysis and Reporting displays the Composite Request Indicator only for home requests, and not for the other participating requests/transactions.
The following procedure describes how to locate composite requests using Performance Analysis and Reporting.
To locate composite requests using the Performance Analysis and Reporting:
- View a Request/Transaction Analysis Trend Report for servers that
you believe may have served home requests of composite requests.
Choose appropriate Report Filtering Options and Date Range Settings.
A Trend Report is displayed.
- Choose an appropriate Decomposition option (Additional
Detail selection) and time period.
A Decomposition Report is displayed.
- View the requests/transactions that comprise the Decomposition
Report by selecting an appropriate segment of the Decomposition Report.
A Detail Report is displayed.
The resulting Detail Report displays a list of the requests/transactions included in the segment of the Decomposition Report you selected.
In addition to the normal output (which includes the Request/Transaction Name, Request/Transaction Type, Response Time, CPU Time, Server Name, Timestamp, and Number of Records). ITCAM for WebSphere and J2EE identifies that a request was a home request of a composite request by displaying the Composite Request Indicator next to its Request/Transaction Name.
View composite requests
Once you have located individual requests/transactions that participate in composite requests (by using ITCAM for WebSphere and J2EE features described in the preceding section,) you can click these request/transactions' Composite Request Indicator to access the composite request features. This section describes how to use the composite request features of ITCAM for WebSphere and J2EE.
Composite request features
Composite requests have the following features:
- Composite Method Trace—Displays the interrelated method traces across all requests involved in the composite request.
- Composite Stack Trace—Displays a continuous stack trace of all servers involved in the composite request which are still actively processing the request/transaction.
View a Composite Method Trace
The Composite Method Trace shows the interrelated method traces of all requests involved in a Composite Request.
You arrive on this page by clicking a Composite Request Indicator. Composite Request Indicators are located next to requests that participate in composite requests on pages that display individual requests/transactions, such as In-flight Request Search. (There is no way to access this page directly from the top navigation.)
The Composite Method Trace page provides method trace data for one request at a time, and enables you to navigate to the other participating requests.
To view a Composite Method Trace:
- From the top navigation, click Problem Determination > In-Flight
Request Search.
The In-Flight Request Search page displays active requests. Requests that participate in composite requests are identified by the Composite Request Indicator.
- To view the Composite Method Trace, click a request's Composite Request Indicator. The Composite Method Trace page opens to the method trace for that request, within the Flow View tab.
Figure 8. Composite Method Trace
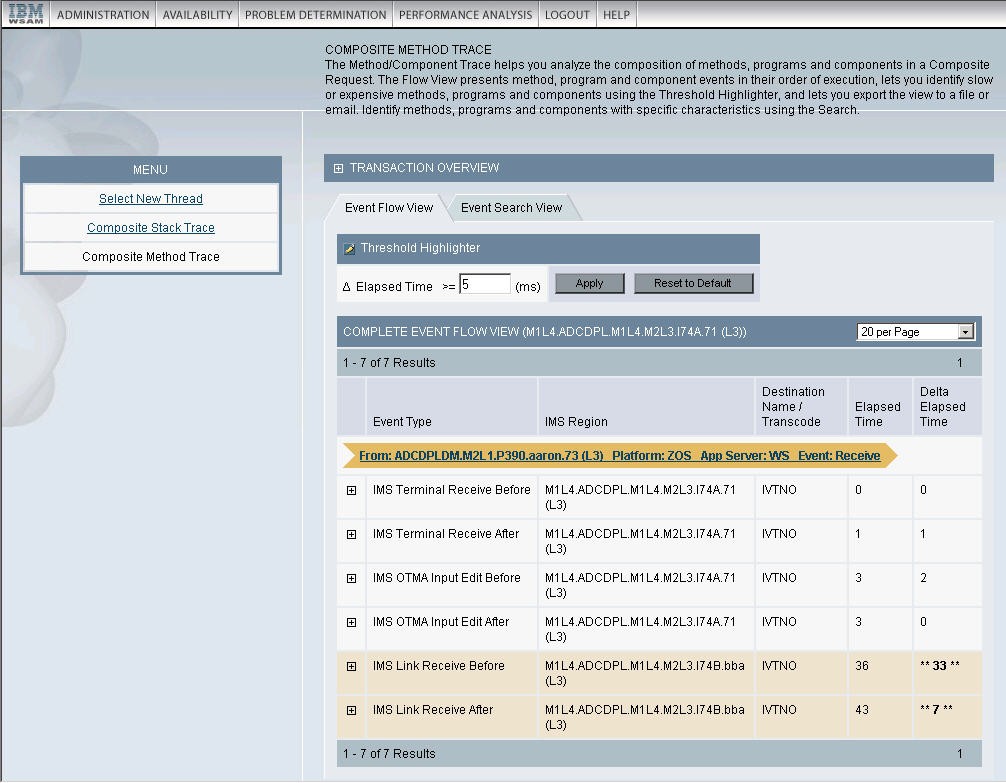
The Transaction Overview section at the top of the page displays summary information about each request that participates in the composite request:
- Server Name
- Platform
- Start Time
- Resident Time (ms)
- Status
Click any server name displayed in the Transaction Overview to arrive at the Request Detail page for that request, which provides further information about that request/transaction and enables you to take action on the thread if it is still active.
The Flow View section, located below the Transaction Overview section, displays the method trace content for a participating request.
Arrows are used within the method trace data to identify relationships with other requests. Click the links or use the controls within these arrows to navigate to the method trace page for associated requests.
The Modify View section lets you toggle the view between a complete view with all the method data, and a view with only the relationship arrows. The name of the server on which the current request is running is displayed in parenthesis after the title (either Complete Flow View or Composite Interactions).
Composite Method Trace and
Like the (single-server) Method Trace, the availability of method-level data is contingent upon the configuration of the data collectors: they must be running at L3 in order to provide full method-level data, and they will provide Nested Request data if they are running at L2.
Since the monitoring levels of data collectors are independent, it is possible that method-level data is available for some, but not all, servers participating in a composite request. The Composite Method Trace presents all data it has, which means that the level of data presented from server to server may vary.
Navigating within Composite Method Trace
From the left navigation in Composite Method Trace, you can proceed to the Composite Stack Trace page. The Composite Stack Trace link is only available if the request is still active. This feature is described in the subsequent sections of this chapter.
To return to In-Flight Request Search (or to proceed there if we arrived from some other feature), follow the Select New Request link in the left navigation. The Select New Request link always proceeds to In-Flight Request Search, regardless of how you arrived at Composite Request Detail.
View a Composite Stack Trace
The Composite Stack Trace page displays the stack traces of each server involved in the composite request that are actively processing their request/transaction.
The Composite Stack Trace is primarily useful for debugging composite requests that are hanging, since there will be no stack trace data available if a composite request has completed by the time you access it.
To debug completed composite requests, use Performance Analysis and Reporting to locate an example, and then use the Composite Method Trace.
You arrive on Composite Stack Trace by following the Composite Stack Trace link on the Composite Method Trace page. The stack trace data is gathered in real time at the point when you follow the Composite Stack Trace link.
To view a Composite Stack Trace:
- From the top navigation, click Problem Determination > In-Flight
Request Search.
The In-Flight Request Search page displays active requests/transactions. Requests/transactions that participate in composite requests are identified by the Composite Request Indicator.
- To view the Composite Method Trace for a request/transaction
that is participating in a composite request, click that request/transaction's Composite Request Indicator.
The Composite Method Trace page for that composite request opens.
- Click Composite Stack Trace in the left
navigation.
The Composite Stack Trace page opens and displays the stack traces of the servers that are actively executing participating requests/transactions.
The Composite Stack Trace page has two parts. The top portion of the page displays:
- Snapshot Date
- Snapshot Time
- Start Time
- Number of Active Requests
- Home Server Name
- Home App Server Type
- Resident Time
The second portion includes the stack trace content. Within the bottom portion of the page, the stack trace of each server is preceded by a line that includes:
- Server Rank
- Server Name
- Operating System
- Application Server Type
The servers are listed in order of Server Rank, which is the order in which the servers are invoked within the context of the composite request.
Each individual server's stack trace is a list of method/program calls, starting with the method/program being executed when the stack trace is obtained, and continuing in Last-In-First-Out order. The data includes the Depth, Class Name and Method/Program Name.
Authorization and composite requests
Authorization is enforced in ITCAM for WebSphere and J2EE in two ways: by feature and by server. Feature-based authorization limits access to top-level features based on the role assigned to a user. Assuming a user has access to a feature, the server-based authorization may further limit access to data about servers based on which group(s) a server is assigned to, and which groups the user has authority to view.
Since composite requests involve more than one server, the effects of server-based authorization play out in the following scenario.
A composite request's home request is on server A (which is in group A) and invokes a participating request on server B (which is in group B). There are two users who need to investigate this composite request: User A has access to servers in group A but not group B, and user B has access to servers in group B but not group A.
Assuming that each user uses In-Flight Request Search to locate the requests, the results for each user will differ, since the In-Flight Request Search limits results to those requests executing on servers in groups the user has access to. This means that user A will see only request A and user B will see only request B.
In both cases, the Composite Request Indicator will appear next to the request, and will link to a similar Composite Request Detail page. However, the contents of the Composite Request Detail page will be different for each user.
Both users will see the complete composite request, including the Home Request on server A and the Participating Request on server B.
However, the users will not have access to the Request Detail pages of all requests: User A will have access to the Home Request on server A (the request name will be linked), but not to the Participating Request on server B (the request name will not be linked). User B will not have access to the Home Request on server A (the request name will not be linked) but will have access to the Participating Request on server B (the request name will be linked).
Audit Trails
Purpose
Audit trails provide a means for tracing user actions in the system. This helps with both accountability and troubleshooting.
Usage Overview
This feature helps you:
- Keep track of key events.
- Trace events to a user.
- Trace events to a date and time.
- Follow the changes in the definitions of complicated tasks in features such as Trap and Alert Management and Performance Analysis and Reporting.
The audit log files are audit-ms.log and audit-ms-Compound.log. By default, they are located at C:\Program Files\ibm\tivoli\common\CYN\logs in Windows , they are located at /var/ibm/tivoli/common/CYN/logs in Unix.
User Scenarios
Scenario 1: Verifying high server response time
Upon returning from vacation, you see that response time is higher than usual for one of the servers in group ABC. You notice from the Heap Dump Management page that the server is performing heap dumps regularly which is causing the slowness in the response time. You enter the audit trail to find out who scheduled the heap dump. You contact that person and learn that the heap dumps are scheduled for troubleshooting a suspected memory leak in the application.
Scenario 2: Verifying MOD level change
In the role as a production support engineer you observe that the MOD level of a data collector in WAS NDion environment has been set to L2 instead of the expected MOD L1. You ask the Administrator to search the audit trail and find out who changed the MOD level, and find that an application support engineer is troubleshooting a production issue in the application.
Request Mapper
Purpose
Use the Request Mapper to customize how requests are named within the Application Monitor. Also, use the Request Mapper to display user names associated with requests.
Usage Overview
This feature helps you:
- Distinguish among requests that otherwise would have the same request name.
- Aggregate requests which otherwise would have distinct request names.
- Identify the User IDs under which requests run.
User Scenarios
Scenario 1: Aggregating Across Distinct Original Request String (ORS)
The application you are monitoring uses a distinct URI to represent each specific application function, such as log in, check out, or log out. You wish to analyze all these requests as a single application. Use the Request Mapper to populate the Request Name field with a common application name.
Scenario 2: Differentiating a Uniform ORS
You are monitoring an application that uses session variables to represent the underlying function, while using the same request name throughout these different interactions. You want to compare the performance of different application functions, such as log in, check out, or log out, so you use the Request Mapper to assign each function a distinct request name.
This feature is not available for IMS.
Data used by the Request Mapper
Request name
The Request Name enables the user to assign alternate request identifiers that are more meaningful and appropriate to the chosen programming model of the application.
The Request Name is provided because the Request String is just one way of identifying requests. There is data that is within the request that is not represented by the Request String. Furthermore, requests can be rather cryptic, so mapping them to something more immediately recognizable or understandable is useful.
For example, a Web request can be mapped by:
- URI: /account/login
- Servlet Class Name: com.cyanea.web.AccountServlet
- Struts Class Name:
http://www.cyanea.com/account/execute/login.do --> com.cyanea.web.account.LoginAction - Custom Naming Scheme: account.login
When the installed Request Mapper is invoked, data is passed into this plug-in class to assist the custom code developer to make a decision. This includes the Request Object and the Session Object in the case of a URL based request.
Application Name
The Application Name enables you to assign request identifiers that classify their requests into different applications. It is a means to aggregate different ORS into an application label.
The Application Name enables you to analyze their historical data from an application perspective.
For example, requests can be mapped to the following names:
- Account Management
- Web Trading
- Order Management
User IDs
The Application Monitor has the ability to capture, display, and store the user ID of a request that comes into the application server. By default, the user ID is captured by calling the following method:
javax.servlet.http.HttpServletRequest.getRemoteUser()
If the application stores user IDs in the session, configuration will be required. User IDs are defined as Web-side identifiers of who initiated the transaction/request.
To capture the user ID from the session, we need to enable the data gathering from the session, and specify the attribute in the session that contains the user ID.
To enable the data gathering from the session, update the data collector properties as follows:
com.cyanea.mapper.http.userid.source=session
To capture the attribute called account name from the session, update the data collector properties as follows:
com.cyanea.mapper.http.userid.attributename=accountname
Default request mapping behavior
From the application server perspective, there are two major types of requests: JSP and Servlet. These calls come either from a Web server, or from an application server other than itself.
We call this request, generally expressed in the form of a string, the ORS. The ORS is composed of the URI plus the query string.
While a unique ORS can be used to represent a specific application function such as log in, check out, and log out, this may not always be the case. Other styles of application design utilize different programming techniques to represent the underlying function, while still maintaining a simple, uniform ORS throughout a series of interactions.
When monitoring applications that use such a design, you can use the Request Mapper to distinguish among these different interactions that use the same ORS.
In addition, when performing workload characterization and understanding resource consumption, an analyst may sometimes find that it is neither possible nor effective to break down consumption simply by ORS, especially if there are too many of them. Aggregation of consumptions based on classification of ORS is more desirable.
The Request Mapper functionality is designed to resolve these types of problems. When an application server receives a request (ORS), the Request Mapper will enable the ORS to be rewritten into two other strings before it is passed on to ITCAM for WebSphere and J2EE:
- Request Name
- Application Name
If no request mapper is used, the Application Monitor will map the incoming ORS onto a Request Name and an Application Name using the following rule:
Request Name     = ORS without the host name
Application Name     = URI of ORS
In-flight Request Search is conducted on the Request Name. Server Activity Display uses Request Name for the display. Performance Analysis and Reporting performs decomposition by Application Name.
Tweak a Request Mapper
Request Mapper is highly sensitive to performance since it is frequently invoked. A poor-performing Request Mapper can have an adverse effect on the overall performance of the application server in terms of Servlet response time as well as CPU costs.
WebSphere 6.1 uses a different class loading mechanism than WebSphere 6.0 or WebSphere 5.1.1, therefore complete the following steps to configure the Request Mapper for WebSphere 6.1:
- Stop the WebSphere server.
- To configure a Request Mapper...
- Assuming the requestmapper classes are packaged in requestmapper.jar, create the Request Mapper class plugins and package them into the jar file.
- In the datacollector_custom.properties file located in the DC_home/runtime/app_server_version.node_name.server_name/custom/
directory, set the am.requestmapper property as follows:
am.requestmapper= <fully qualified requestmapper class name>
where fully qualified requestmapper class name is the Request Mapper class that implements the ITCAM Request Mapper interface and is packaged in requestmapper.jar. - Put the library requestmapper.jar in DC_home/itcamdc/lib/ext
- (Optional) The following steps are optional, they provide an example
of how to configure a Request Mapper and avoid mixing the Request
Mapper specific properties with other JVM system properties. This
is done by creating a separate Request Mapper properties file and
including all the Request Mapper properties in this file. In this
way, to add additional Request Mapper properties, you
can do so without exposing them to other code either in the data collector
or in the application server. The following steps provide an example
of this optional approach:
- Create a property file called requestmapper.properties and put all the Request Mapper specific properties in this file. Put the requestmapper.properties file in DC_home/runtime/DC_specific dir.
- In the datacollector_custom.properties file located in the DC_home/runtime/app_server_version.node_name.server_name/custom/
directory, set the customer.reqestmapper.file property as follows:
customer.requestmapper.file=
	DC_home/runtime/DC_specific dir/requestmapper.properties
- In the RequestMapper code, get the location of requestmapper.properties file by doing System.getProperty("customer.requestmapper.file")
- Restart the WebSphere server.
Java docs and an example follow:
Package com.cyanea.mapper
| Interface Summary | |
|---|---|
| MappedRequest | Interface used for providing the ITCAM for WebSphere and J2EE system with a Distinguishable Request String (DRS) and a Collapsible Request String (CRS) about a particular Servlet request. |
| RequestMapper | ITCAM for WebSphere and J2EE recognizes JSP and Servlet requests on an application server. |
Interface mapped request
public interface MappedRequest
Interface used for providing the ITCAM for WebSphere and J2EE system with a DRS and a CRS about a particular servlet request.
| Method Summary | |
|---|---|
| java.lang.String | getCRS ( ) |
| java.lang.String | getDRS( ) |
Interface Request Mapper
public interface RequestMapper
ITCAM for WebSphere and J2EE recognizes JSP and servlet requests on an application server. These requests are normally identified throughout the ITCAM for WebSphere and J2EE system using the URI of the request. In some situations, such as when a Struts design paradigm is used, a particular URI will be used to handle different types of business requests.
ITCAM for WebSphere and J2EE provides this interface as a mechanism for modifying ITCAM for WebSphere and J2EE's default behavior of using the URI to describe the request. An implementation of this interface can be installed by registering the classname with the Java executable as a system property.
To install, specify the system property "am.requestmapper" with the implementing class as the value.
For example:
-Dam.requestmapper=com.cyanea.mapper.RequestMapperExample
| Method Summary | |
|---|---|
| MappedRequest | mapRequest
(java.lang.String servletClassName, javax.servlet.http.HttpServletRequest request) This stateless method translates a servlet classname and a URL into a MappedRequest object. |
Sample Request Mapper - mapRequest
public MappedRequest mapRequest(    java.lang.String servletClassName,
javax.servlet.http.HttpServletRequest request)
This stateless method translates a servlet classname and a URL into a MappedRequest object. Any RequestMapper class should attempt to execute this method as quickly as possible, due to the fact that it lies directly in the path of the application server thread execution.
- Parameters:
- ServletClassName - the name of the ServletClass handling this request.
- request - the HttpServletRequest object for this request.
- Returns: An instance of MappedRequest indicating the DRS and CRS to be used by the ITCAM for WebSphere and J2EE system.
Request Mapper Example (1):
package com.cyanea.mapper;
public class MappedRequestExample implements MappedRequest {
    private String CRS;
    private String DRS;
    /** Creates a new instance of MappedRequestExample */
    public MappedRequestExample(String myCRS,String myDRS) {
        CRS = myCRS;
        DRS = myDRS;
    }
    public String getCRS() {
        return CRS;
    }
    public String getDRS() {
        return DRS;
    }
}
Request Mapper Example (2):
package com.cyanea.mapper;
import javax.servlet.http.HttpServletRequest;
public class RequestMapperExample implements RequestMapper {
    /** static MappedRequest instance for welcome page requests
     */
    private static final MappedRequest welcomeRequest;
    /** static MappedRequest instance for quote page requests
     */
    private static final MappedRequest quoteRequest;
    /** static MappedRequest instance for buy page requests
     */
    private static final MappedRequest buyRequest;
    /** static MappedRequest instance for sell page requests
     */
    private static final MappedRequest sellRequest;
    /** static MappedRequest instance for portfolio page requests
     */
    private static final MappedRequest portfolioRequest;
    /** static MappedRequest instance for account page requests
     */
    private static final MappedRequest accountRequest;
    /** static MappedRequest instance for update page requests
     */
    private static final MappedRequest updateRequest;
    /**
     * Static class variables are used to avoid continuous object creation
     * of redundant information on a per-client-request basis. An
     * unsynchronized, read-only HashMap can also be used for looking up
     * MappedRequest instances to gain a performance increase.
     **/
    static {
welcomeRequest   = new MappedRequestExample("Welcome Page","welcome");
quoteRequest     = new MappedRequestExample("quote","quote");
buyRequest       = new MappedRequestExample("trade","buy");
sellRequest      = new MappedRequestExample("trade","sell");
portfolioRequest = new MappedRequestExample("overview","portfolio");
accountRequest   = new MappedRequestExample("account","account");
updateRequest      = new MappedRequestExample("account","updateAccount");
    }
    /** Creates a new instance of RequestMapperExample */
    public RequestMapperExample() {
    }
    /**
     * This example checks the HttpServletRequest object for the GET or POST
     * parameter "map".  If the parameter "map" is not found, "action" is
     * used. This "action" string, is then used to look up the corresponding
     * MappedRequest object. If no MappedRequest object is found, a new
     * object is created and returned.  This should be avoided, as it can be
     * an expensive operation.
     */
    public MappedRequest mapRequest(String servletClassName,
HttpServletRequest request) {
        String action = request.getParameter("map");
            if ( action == null) {
                action = request.getParameter("action");
            if ( action == null )
                return welcomeRequest;
        }
        /* A HashMap lookup could also be performed here instead of iterating
         * a list of string comparisons.  If a list of strings comparison are
         * used, it is desirable to list the most common action first.
         */

        if ( "quote".equals(action) )
            return quoteRequest;
        else if ( "buy".equals(action) )
            return buyRequest;
        else if( "sell".equals(action) )
            return sellRequest;
        else if( "portfolio".equals(action) )
            return portfolioRequest;
        else if( "account".equals(action) )
            return accountRequest;
        else if( "updateAccount".equals(action) )
            return updateRequest;
        else
            return new MappedRequestExample(action,action);
    }
    }
Appendix A. Support information
If we have a problem with the IBM software, you want to resolve it quickly. IBM provides the following ways for you to obtain the support we need:
- Online
- Go to the IBM Software Support site at http://www.ibm.com/software/support/probsub.html and follow the instructions.
- IBM Support Assistant
- The IBM Support Assistant (ISA) is a free local software serviceability workbench that helps you resolve questions and problems with IBM software products. The ISA provides quick access to support-related information and serviceability tools for problem determination. To install the ISA software, go to http://www.ibm.com/software/support/isa.
- Troubleshooting Guide
-
See about resolving problems, see WAS ND's Troubleshooting Guide.
Obtaining fixes
A product fix might be available to resolve the problem. To determine what fixes are available for the IBM software product, follow these steps:
- Go to the IBM Software Support Web site at http://www.ibm.com/software/support.
- Click Downloads in the Software section.
- Under the Updates, drivers, and fixes section, select Fixes, fixpacks and utilities.
- Navigate to ITCAM for WebSphere or ITCAM for J2EE to obtain a list of available fixes.
See about the types of fixes that are available, see the IBM Software Support Handbook at http://techsupport.services.ibm.com/guides/handbook.html.
Receiving support updates
To receive e-mail notifications about software support news and updates, follow these steps:
- Go to the IBM Software Support Web site at http://www.ibm.com/software/support.
- On the right hand side, click My Notifications.
- If we have already registered for My Notifications, login. If we have not registered, click register now. Complete the registration form using the e-mail address as the IBM ID. When you have logged in, the My notifications for IBM technical support home page is displayed.
- Select the Subscribe tab.
- Under the Software list, select Tivoli .
- Select Tivoli Composite Application Manager for J2EE and/or Tivoli Composite Application Manager for WebSphere . Click Continue.
- In the Options section, enter a folder name, update notifications will be saved in this folder.
- In the Notify me by section, choose if we want to me notified of updates daily or weekly.
- In the Notify me by section, choose if we want to receive notifications in plain text or html.
- In the Document Types section, customize the types of information you want to be updated on, for example, white papers, drivers etc. Click Submit.
If we experience problems with the My Notifications feature, you can obtain help in one of the following ways:
- Online
- Send an e-mail message to erchelp@ca.ibm.com, describing the problem.
- By phone
- Call 1-800-IBM-4You (1-800-426-4968).
Appendix B. Accessibility
Accessibility features help a user who has a physical disability, such as restricted mobility or limited vision, to use software products successfully. These are the major accessibility features you can use with IBM Tivoli Composite Application Manager when accessing it via the IBM Personal Communications terminal emulator:
- You can operate all features using the keyboard instead of the mouse.
- You can read text through interaction with assistive technology.
- Use system settings for font, size, and color for all user interface controls.
- You can magnify what is displayed on the screen.
Where to find more information
To access the Tivoli software information center go to Tivoli software library, scroll down and click the Tivoli Product manuals link, and then in the Tivoli Technical Product Documents Alphabetical Listing window, click the IBM Tivoli Composite Application Manager link.
| ITCAM for WebSphere - Tuning and Best Practices | Webcast |
| ITCAM for WebSphere and J2EE: Users's Guide | Instructions and user information for the Application Monitor user interface. |
| ITCAM: Managing Server Installation and Customization Guide | Instructions on installing, configuring, customizing, starting, and maintaining the Managing Server for ITCAM for WebSphere and ITCAM for J2EE. |
| ITCAM for WebSphere: Distributed Data Collector Installation and Customization Guide | Instructions on installing, configuring, customizing, starting, and maintaining the Data Collector for ITCAM on the Windows , UNIX , and OS/400 platforms. |
| ITCAM for WebSphere: Community Edition Data Collector Installation and Customization Guide | Instructions on installing, configuring, starting and maintaining the Community Edition Data Collector. |
| ITCAM for WebSphere: z/OS Data Collector Configuration and Customization Guide | Instructions on installing, configuring, customizing, starting, and maintaining the Data Collector. |
| ITCAM for Web Servers: Web Servers Installing and Tweak the Tivoli Enterprise Monitoring Agent | Installation instructions for installing and configuring the TEMA component of ITCAM for Web Servers to monitor availability and performance of Apache Web server, Microsoft IIS, and Sun Java Web server on distributed platforms. |
| ITCAM for WebSphere: Installing and Tweak the Tivoli Enterprise Monitoring Agent | Installation instructions for setting up and configuring the TEMA. |
| ITCAM for WebSphere: Problem Determination Guide | Information about messages and codes generated by the Application Monitor. |
| ITCAM for WebSphere: Tivoli Enterprise Monitoring Agent Problem Determination Guide | Instructions on how to fix problems that may occur and lists the error messages and explanations for those messages for the TEMA. |
| ITCAM for WebSphere: Web Servers Tivoli Enterprise Monitoring Agent Problem Determination Guide | Instructions on how to fix problems that may occur and lists the error messages and explanations for those messages for the TEMA. |
| ITCAM for J2EE: Installing and Configuring the Data Collector | Instructions on installing, configuring, customizing, starting, and maintaining the Data Collector for ITCAM on the Windows , UNIX , and OS/400 platforms. |
| ITCAM for J2EE: Installing and Configuring the Tivoli Enterprise Monitoring Agent | Installation instructions for setting up and configuring the TEMA. |
| ITCAM for J2EE: Problem Determination Guide | Information about messages and codes generated by the Application Monitor. |
| ITCAM for J2EE: Web Servers Tivoli Enterprise Monitoring Agent Problem Determination Guide | Instructions on how to fix problems that may occur and lists the error messages and explanations for those messages for the TEMA. |
| ITCAM for J2EE: Tivoli Enterprise Monitoring Agent Problem Determination Guide | Instructions on how to fix problems that may occur and lists the error messages and explanations for those messages for the TEMA. |
| ITCAM for CICS Transactions Product Guide | Information about the installation, configuration, and use of the Application Monitor CICS Data Collector. |
| ITCAM for IMS Transactions Product Guide | Information about the installation, configuration, and use of the Application Monitor IMS Data Collector. |
| ITCAM Program Directory | Complete installation instructions for the Application Monitor Engine. |
| ITCAM Program Directory for the CICS Data Collector | Complete installation instructions for the Application Monitor CICS Data Collector Engine. |
| ITCAM Program Directory for the IMS Data Collector | Complete installation instructions for the Application Monitor IMS Data Collector Engine. |
Glossary
- Active
-
- Determines if the consumer is active.
- Determines whether the consumer has a message listener set up, or if a synchronous receive is in progress.
- Determines whether the subscription is being used by a durable subscriber.
- Active Global Transactions
- The number of concurrently active global transactions.
- Active Local Transactions
- The number of concurrently active local transactions.
- Active methods
-
- The average number of concurrently active methods.
- The average number of invocations being processed concurrently for all methods.
- Active Requests
- The requests being serviced.
- Active Sessions
-
- The number of concurrent, active sessions.
- The number of communication sessions active during the interval.
- The current number of HTTP sessions actively referenced in the server during the interval.
- Active Threads
- (1) The number of concurrent, active threads.
- (2) The thread that is servicing a request.
- Active Thread Count
- The number of activated thread.
- Active Thread Group Count
- The number of activated thread group.
- Additional Detail
-
- A dynamically generated list based on the selections made by the user when creating a report.
- A drop-down menu for viewing the detailed report broken down by different criteria in a Trend Report.
- Admin Server
- The name of the administration server that oversees the functions of the appservers.
- Admin Server Host
- The address on which the admin server is listening for connections.
- Admin Server Listen Port
- The port on which the admin server is listening for connections.
- Affinity Breaks
- The number of HTTP session affinities broken, not counting intentional breaks of session affinity.
- Alert Condition
- The definition of when to trigger the selected action(s).
- AMC Name
- The AMC Name of the bean activated by the container (only the rightmost 256 characters are recorded).
- Application Server
- The name of the application server monitored by a data collector.
- Application Server IP Address
- The IP address for the selected application server.
- Application Server Name
-
- The name of the selected application server.
- The Sysplex node name concatenated with the server instance name.
- The name of the server where the session is executing.
- Application Server Start Time
- The time that the application server started running.
- Application Server Uptime
-
- The amount of time that has elapsed since the application server started running.
- The system highlights this number on the Server Statistics Overview page when the amount of time that has passed since the application server started running exceeds the threshold value.
- Application Trap
- A trap based on data from an application.
- Archive Agent
- Accepts the aggregated data from a publish server and performs fast data archiving into the database for reporting purposes.
- Authentication
- Verifies the identity of a user who logs into the Application Monitor.
- Authoritative Date/Time Stamp
- The authoritative date/time when data was frozen.
- Authoritative Only
- The file only exists on the authoritative server.
- Authoritative Server
- The server in a server group against which up to 10 other servers in the group are compared (the Comparison Servers).
- Authoritative Size
- The size of the file found on the authoritative server.
- Average Active Usage
- The running average of connections that are active in the Connector Pool, since the pool was last shrunk.
- Average CPU Time per Nested Request Invocations
- Response time is defined as (CPU Clock at the time of the nested request finish - CPU Clock at time of the nested request start). This field is the average of this value for all of the nested requests in the sample.
- Average CPU Time per Request/Transaction
- Response time is defined as (CPU Clock at the time of request finish - CPU Clock at time of request start). This field is the average of this value for all of the requests in the sample.
- Average CPU Usage
- The average percentage that the CPU has been busy since the server was started.
- Average Contention Time
- The average time (in milliseconds) spent on each monitor contention. The valid format is a positive integer.
- Average Create Time
- The average method response time for creations in milliseconds.
- Average Drain Size
- The average number of objects discarded in each drain. Applies to entity and stateless beans.
- Average Execution Time
- The average amount of time, in milliseconds, of all invocations of a servlet to date.
- Average Garbage Collection Duration
- The average duration of a garbage collection call.
- Average Heap Size after Garbage Collection
- The average dynamic storage for a procedure after inactive data is deleted.
- Average Invalidation Time
- The average time required to invalidate HTTP sessions.
- Average Method Response Time
- The average response time, in milliseconds, of all invocations of the remote interface for this bean.
- Average Method Response Time for Create
- The average time, in milliseconds, it takes to create a bean, including load time.
- Average Method Response Time for Remove
- The average time, in milliseconds, for a beanRemove call, including the time at the database.
- Average Number of Method Calls per Request/Transaction
- Average (over the sample shown on the Detail tab) of the number of method and nested request invocations occurring between the request start and end.
- Average Pool Size
- The average number of objects in the pool. Applies to entity and stateless beans.
- Average Remove Time
- The average response time, in milliseconds, for removes.
- Average Response Time
- The average elapsed time between entering a request and receiving a response.
- Average Response Time per Nested Request Invocations
- Response time is defined as (Wall Clock at the time of the nested request finish - Wall Clock at time of the nested request start). This field is the average of this value for all of the nested requests in the sample.
- Average Response Time per Request/Transaction
- Response time is defined as (Wall Clock at the time of request finish - Wall Clock at time of request start). This field is the average of this value for all of the requests in the sample.
- Average Sessions Lifetime
- The average lifetime of invalidated HTTP sessions.
- Average Time between Garbage Collection Calls
- The average time (in seconds) between two successive garbage collection calls.
- Average Time In Use
- The average time of the connection pool that is in use.
- Average Time to Acquire Lock
- The average time (in milliseconds) spent on each monitor locking. The valid format is a positive integer.
- Average Time Wait for Lock
- The average time that a thread waits for a lock.
- Average Use Time
- The average time, in milliseconds, a connection is used by a request.
- Average Wait Time
- The average time, in milliseconds, a request waits for a connection.
- Average Waiting Threads
- The average number of threads concurrently waiting for a connection.
B
- Baseline Definition
- The threshold to which a server group's average response time is compared.
- Baseline Indicator Settings
- The percentage above the baseline that you determine to be slow or very slow. “Slow response” means the present response time is between 26% and 50% above the baseline as in the example above; “very slow response” means the present response time exceeds the baseline by 50% or above. When the response time reaches Indicator 1, an orange indicator displays on the Application Overview page; a red indicator means the response time has exceeded Indicator 2 and the system is very unhealthy.
- Baseline Response Time
- The historical response time, displayed on the Application Overview page, to which the current response time is compared.
- Baseline Response Time Sample Duration
- The number of days used to determine the average Baseline Response Time.
- Bytes Received
- The number of bytes transferred to the server from all clients.
- Bytes Sent
- The number of bytes sent from the server to all clients.
- Bytes Threshold Time
- The amount of time in the threshold condition since the last reset.
C
- Cache Discards
-
- The number of session objects that have been forced out of the cache. Applicable only for persistent sessions.
- The total number of statements discarded because the statement cache is at its maximum size.
- Cancel Request
- A method for terminating application requests from the system. Cancel Request terminates the request by throwing a run-time exception. All necessary cleanup will occur accordingly.
- Capacitive Increment
- The initial capacity configured for the Connector connection pool.
- Change Priority
- A feature that lets you raise or lower the priority of a thread, by selecting a different priority number. Priority 1 is the lowest and priority 10 is the highest.
- Change Thread Status
- A feature that lets you freeze the execution of a thread so you can investigate the problem further, and then reactivate it when the problem is resolved.
- CICS Transaction Gateway
- This page lists all the CTGs that the selected J2EE server has contacted.
- Class
- A collection of related data and methods (operations).
- Class Acquiring Locks
- The name of the class that accessed a monitor. The valid format is an alphanumeric string, maximum 128 characters.
- Class Path
- The pathname where the Class is stored.
- Client ID
- The client ID for the connection/durable subscriber.
- Client Request
- The request by a client for a particular server resource. This resource is often a Web page or a Java application.
- Client Request Start
- The start date and time for the current request.
- Community
- A string that is part of the SNMP protocol.
- Comparison Date/Time Stamp
- The date/time of the comparison.
- Comparison Only
- The file only exists on the Comparison Server.
- Comparison Servers
- The servers whose installed binaries are compared to those on the authoritative server.
- Component ID
- An ID assigned by the system for identification.
- Composite Request Transactions
- The requests that conform to an Enterprise Application Integration architecture. The requests for Web-enabled Legacy applications. It enables the user to monitor transactions that utilize resources on more than one server.
- Concurrent Actives
- The average level as a function of time of bean instances of the home that are in the ready state (active beans). A measure of server activity.
- Concurrent Lives
-
- The average number of concurrently live beans.
- The average level, as a function of time, of bean objects that exist in runtime, whether the objects are active or pooled (instantiated but not destroyed). A measure of how many resources the home interface consumed.
- Concurrent Requests
-
- The number of requests that are concurrently processed by the ORB.
- The number of requests that are concurrently processed by servlets.
- Concurrent Waiters
- The average number of threads concurrently waiting for a connection.
- Condition
- A user-defined criteria that is part of a trap definition.
- Configuration Name
- The name of the configuration you apply to the data collector.
- Configuration Profile
- This parameter provides the name of the Configuration Repository of the Kernel.
- Connected Kernel
- The IP address and port number for the Kernel.
- Connection Delay Time (ms)
- The average time (in milliseconds) necessary to get a connection from the database. This is how long it takes to get a physical connection from the database. It is calculated as summary time to connect divided by the number of connections.
- Connection factory
- A connection factory is an object whose sole purpose is to create connection objects. When an application needs a connection, it asks the connection factory to "manufacture" a connection object.
- Connection Factory Name
- The configured Connection Factory Name for the Connection Factory using this Connector connection pool.
- Connection Pool Faults
- The number of faults (e.g. time-out) in a connection pool.
- Connector Pool Name
-
- The configured Logical Name for a Connection Factory (using this Connector connection pool).
- The name of the connection pool a SQL statement belongs to.
- The name of the connection pool for a leaked connection.
- Container Thread Pool
- The current number of threads in a container.
- Context Root
- The context root (context path) for a Web application.
- Contrast Options
- A second data set used for the purpose of comparative analysis.
- Cookies and Attributes
- The name and contents of the cookies associated with a session.
- CPU Speed
- How fast the CPU processes the runtime environment comparison.
- CPU Utilization (%, Last Hour)
- The percentage of CPU being utilized in last hour.
- Created Sessions
- The number of sessions that were created.
- CRS
- Collapsible Request String.
- Current Total CPU Time
- The total CPU time used to process the current (active) request.
- Current Total Elapsed Time
- The total time that has elapsed since a request began executing.
- Custom Request Type
- The user defines a custom request in a configuration file that allows instrumentation of a class.
D
- Daemon Thread Group
- A thread group which contains the program that runs unattended to perform continuous or periodic functions, such as network control.
- Data Collector
- A component of the Application Monitor. Software that runs alongside an application server and captures information regarding the internal workings of the application server.
- Data Collector Controller
- Controls the behavior of a data collector, including the monitoring level, filter list, and enable or disable status.
- Data Collector Listen Port
- The port that clients of the data collector use to communicate with the data collector.
- Data Collector Uptime
- The amount of time that has passed since the data collector started running.
- Data Grouping
- Aggregates a data set based on a selected time interval, i.e., month, date of the month, day of the week, and hour of the day.
- Data Interval
- Part of the user-specified definition of a report. The distance between points on the X axis of a report.
- Database Connection Pool
-
- A group of database connections. A new request is assigned a free connection from the pool. Upon completion of the request, the system returns the connection to the pool.
- An indicator that displays the number of connections in use and the total number of connections in the pool, for a selected Application Server.
- Database Connection Pool Name
- The name of the Database Connection Pool.
- Database Name
- The name of the database that the connection is associated with.
- Date Range
- The start and end dates for the report.
- Decomposition Report
- A report that provides a breakdown of the Trend Report by a user-selected criteria.
- Default Data Collector Configuration
- The configuration assigned to new Data Collectors to capture information regarding the applications running inside the application server.
- Default Monitoring Level
- The monitoring level used by all servers when they initially connect to the Application Monitor as well as appservers (or groups of appservers) whose monitoring level is not explicitly set. The default monitoring level for all platforms except z/OS is L2 (Problem Determination Mode). For the z/OS platform, the default monitoring level is L1 (Production Mode).
- Destination Name
- The destination for the consumer.
- Device Host Name
- The name or address of the network management server being sent SNMP messages.
- Drains from Pool
- The number of times the daemon found the pool was idle and attempted to clean it. Applies to entity and stateless beans.
- DRS
- Distinguishable Request String.
- Durable
- Determines whether the consumer is durable.
- Durable Subscribers
- With a Durable JMS Subscriber, messages are persisted by the JMS system when the subscriber is not available, normally in a database store. When the durable subscriber becomes available, the JMS server will provide them with the messages that the subscriber missed due to its unavailability.
E
- EAI
- Enterprise Application Integration. It refers to the plans, methods, and tools aimed at modernizing, consolidating, and coordinating the computer applications in an enterprise. EAI involves integrating an enterprise's new and existing applications.
- EAR File
- Enterprise Archive File. The number of Enterprise Archive files on the application server.
- EJB
- Enterprise Java Bean. Component architecture for the development and deployment of object-oriented, distributed, enterprise-level applications. Applications written using the EJB architecture are scalable, transactional, and secure.
- EJB Activity
- The amount of EJB calls made for the last hour with a 5 minute refresh rate.
- EJB Coverage
-
- The distribution of EJB invocations in the last hour, by EJB Home name.
- The graphical representations of the most frequently accessed EJBs.
- EJB Home
- The name of the Enterprise Java Bean method.
- EJB Name
- The name of an EJB component.
- EJB Role
- The list of EJB Roles associated with the method separated by a semicolon ";" up to 256 characters.
- EJB Type
- The bean's type (CMP entity bean, BMP entity bean, stateless session bean, and stateful session bean).
- EJB Volume
- The number of times that EJB methods were invoked on the application server.
- ejbActivate Average Execution Time
- The average execution time of the method ejbActivate.
- ejbActivate Invocations
- The number of ejbActivate invocations.
- ejbActivate Maximum Execution Time
- The longest execution time of the method ejbActivate.
- ejbLoad Average Execution Time
- The average execution time of the method ejbLoad.
- ejbLoad Invocations
- The number of ejbLoad invocations.
- ejbLoad Maximum Execution Time
- The longest execution time of the method ejbLoad.
- ejbPassivate Average Execution Time
- The average execution time of the method ejbPassivate.
- ejbPassivate Invocations
- The number of invocations of the method ejbPassivate.
- ejbPassivate Maximum Execution Time
- The longest execution time of the method ejbPassivate.
- ejbStore Average Execution Time
- The average execution time of the method ejbStore.
- ejbStore Invocations
- The number of invocations of the method ejbStore.
- ejbStore Maximum Execution Time
- The longest execution time of the method ejbStore.
- Entity Bean
- An enterprise bean that represents persistent data maintained in a database. An entity bean can manage its own persistence or it can delegate this function to its container.
- Enterprise Overview
- Feature that displays the availability, aggregated by server groups, of all applications running on the appservers in a server group.
- Errors
- The number of errors encountered by a servlet.
- Exclude (Classname)
- A list of classes that will not be monitored unless they are part of the Exclude Override (Classname).
- Exclude Override (Classname)
- A subset of classes in the Exclude (Classname) that will be monitored.
- Execution Time High
- The amount of time, in milliseconds, of the single longest invocation of the servlet.
- Execution Time Low
- The amount of time, in milliseconds, of the single shortest invocation of the servlet.
- Execution Time Total
- The amount of time, in milliseconds, of all invocations of the servlet.
- Existing Sessions
- The number of communication sessions that exist at the end of the interval.
- External Read Size
- The size of the session data read from the persistent store. Applicable only for (serialized) persistent sessions.
- External Read Time
- The time (in milliseconds) taken when reading the session data from a persistence store. For multi-row, the metrics are for the attribute; for single row, the metrics are for the whole session. Applicable only for persistence sessions. This metric is not available for applications that do not serialize data.
- External Write Size
- The size of session data written to persistent store. Applicable only for (serialized) persistent sessions.
- External Write Time
- The time (in milliseconds) taken in writing the session data from persistent store. Applicable only for (serialized) persistent sessions.
F
- Failures to Reconnect
- The number of cases when a connection pool attempted to refresh a connection to a database and failed. Failure may happen because of database unavailability or a broken connection to the database.
- Faults
- The number of faults (e.g. time-out) in the connection pool.
- File Name Match
- The file names only matched. They are unlikely to be the same.
- File Name/Path/Size Match
- Files on comparison servers whose file name, path and size, but not timestamp matched a file on the authoritative server; these files are likely to be the same.
- Finalized Sessions
- The number of sessions that were finalized.
- First Join Time
- The time a component first joined the Kernel.
- Fixed Date
- An interval, specified by a start and end date, for which average response times are calculated (for each five minute period of the day) and used as the baseline against which current response times are compared on the Overview pages.
- Fixed Response Time
- A response time against which all the current response times on the Application Overview will be compared.
- Force GC
- Force Garbage Collection. When this option is enabled, the JVM will perform a garbage collection before taking a heap dump.
- Free Memory
-
- The free memory in JVM runtime.
- The snapshot of free memory, in KB.
- Free Pool Size
- The number of free connections in the pool.
- Full Match
- Files that are likely to be identical to each other based on matching file name, path, size and file system timestamp.
- Full Pathname / Size Match
- Files that are likely to be identical to each other based on matching pathname and file size.
G
- Garbage Collection
- Java automatically reclaims any memory that is no longer needed for reuse through a process called Garbage Collection. An object is considered garbage when there are no longer references to it stored in variables, the fields of any objects, or the elements of an array.
- Garbage Collection Delay
- The amount of time the system should wait prior to taking a second heap snapshot.
- Gets Found
- The number of times a retrieve found an object available in the pool. Applies to entity and stateless beans.
- Gets from Pool
- The number of calls retrieving an object from the pool. Applies to entity and stateless beans.
- Global before Completion Duration
- The average duration of before_completion for global transactions.
- Global Commit Duration
- The average duration of commits for global transactions.
- Global Prepare Duration
- The average duration of prepares for global transactions.
- Global Transaction Duration
- The average duration of global transactions.
- Global Transactions
- The number of global transactions run through and initiated by the server instance during the interval.
- Global Transactions Begun
- The number of global transactions begun on the server.
- Global Transactions Committed
- The number of global transactions committed.
- Global Transactions Involved
- The number of global transactions involved on the server.
- Global Transactions Rolled Back
- The number of global transactions rolled back.
- Global Transactions Timeout
- The number of global transactions timed out.
- Group Name
-
- The name of the group.
- All servers that belong to the group will display on the Server Statistics Overview page.
- Group Overview
- This page provides a high-level overview of activity for each server in the group.
H
- Heap
- A heap is an area of pre-reserved computer main storage (memory) that a program process can use to store data in some variable amount that won't be known until the program is running.
- Heap Dump Management
- NEED DEFINITION
- Heap Size
- The amount of memory allocated to JVM.
I
- Idle Time
- The time that a request has been idling, plus any unaccounted CPU time not captured by the Application Monitor.
- Initial Capacity
- The initial capacity configured for a Connector Connection Pool.
- Installed Binary
- A file deployed to a server. In a server farm, it is important that all the files are the same version.
- Instance Name
- The name of the WebSphere server instance.
- Interceptors
- A callback code that is executed when an ORB request enters or exits the process space.
- Interrupted
- The system stopped the thread.
- Interval Start/End
- The snapshot start time and end time.
- Invalidated Sessions
- The number of sessions that were invalidated.
- Invalidated via Time-Out
- The number of sessions that are invalidated via timeout.
- Invocations
- The number of times the method was invoked during the interval.
- IP Address
- The IP address of the application server.
J
- Java Policy
- The pathname where the Java Policy is stored.
- JDBC Connection Pools
- The number of JDBC connections available on the selected application server.
- JDBC Driver V
- The version of the JDBC driver, in the format of concatenating the Driver class name with 'major: XX, minor: YY'.
- JDBC Operation Timer and JDBC Operation Time
- The amount of time, in milliseconds, spent executing in the JDBC driver.
- JNDI Name
- The configured JNDI Name for a Connection Factory. The name of the Connection Factory using a Connector Connection Pool.
- JSP
- Java Servlet Page. A server-side technology. Java server pages are an extension to the Java servlet technology. JSPs have dynamic scripting capability that works in tandem with HTML code, separating the page logic from the design and display of the page.
- JSP Coverage
- The distribution of servlet/JSP requests in the last hour, by servlet/JSP name.
- JVM
- Java Virtual Machine. A self-contained operating environment that executes pre-compiled Java byte code.
- JVM CPU Delta
- JVM CPU Usage
- The current CPU utilization of the JVM space itself.
- JVM CPU%
- JVM Heap Size
- The size of the heap that is available to the JVM.
- JVM ID
- The JVMID of the server.
- JVM Memory Usage
- JVM Memory Utilization (%, Last Hour)
- The percentage of JVM Memory being utilized in last hour.
- JVMPI
- Java Virtual Machine Profiler Interface. A two-way function call interface between the Java Virtual Machine and an in-process profiler agent.
- JVM / Region CPU Delta
- The difference between the current JVM / Region CPU and its last refreshed data.
- JVM / Region CPU %
- The utilization percentage of JVM / Region CPU.
- JVM Thread
- The basic unit of program execution in the Java Virtual Machine. A process can have several threads running concurrently, each performing a different job. When a thread has finished its job, it is suspended or destroyed.
K
- Kernel
- A component of the Application Monitor that acts as a directory service that keeps track of which components have joined or left the network.
- Kernel Codebase
- The URL where Application Monitor components download binaries from the Kernel.
L
- L1 (Production Mode)
- this monitoring level provides availability management, system resources and basic request-level data. This monitoring level least affects the CPU overhead per transaction and is appropriate for servers that are not malfunctioning.
- L2 (Problem Determination Mode)
- this monitoring level provides production level monitoring plus advanced request data, including external component and CPU information, as well as additional monitoring fields and functions. Under problem determination mode you can view component traces. These are traces that show J2EE request-related events that are made to external services. Use this level when you suspect a problem exists or need to capture data about external events but do not need all the method-level data. When you select L2, you will be given the option to check MP for Method Profiling. This feature enables you to determine how often the data collector will send the data to the managing server: 1-999 minutes. You can view the method profile reports on the Method Profiling Management page.
- L3 (Tracing Mode)
- this is the most powerful monitoring level, therefore only this level utilizes all reporting elements available. For example, in L3 the server activity display shows additional data for the following columns: Accumulated CPU, Last Known Class Name, Last Known Method, and Last Known action. In addition, on the Request Detail page, the method trace with SQL statements are also available. L3 has inherently higher overhead than the other monitoring levels. Therefore, use this level for servers that have been selected for diagnostics and detailed workload characterization.
- Last Access Time
- The last time a client sent a request associated with a session.
- Last Contract Renewal Time
- The most recent renewal time of the contract with the Kernel.
- Last Known Action
- The name of the last action accessed by the current request.
- Last Known Class Name
- The name of the last class accessed by the current request.
- Last Known Method
- The name of the last method accessed by the current request.
- Last Known SQL Statement
- The last SQL statement accessed by the current request.
- Library Path
- The path name where the library is stored.
- Line numbers
- The capability to retrieve the line number from the high-level language source code for each EXEC CICS call made by the program.
- Listen Address
- The address on which a server listens for connections.
- Listen Port
- The port on which a server listens for connections.
- Live Sessions
- The number of live sessions concurrently in cache.
- Load Timestamp
- The timestamp when a servlet was loaded.
- Local Active Sessions
- The number of active local communication sessions attached and active within the server instance, during the interval.
- Local Before Completion Duration
- The average duration of before_completion for local transactions.
- Local Bytes Received
- The number of bytes transferred to the server from all locally attached clients.
- Local Bytes Sent
- The number of bytes transferred from the server to all locally attached clients.
- Local Commit Duration
- The average duration of commit for local transactions.
- Local Existing Sessions
- The number of existing local communication sessions attached and active within the server instance during the interval.
- Local Transaction Duration
- The average duration of local transactions.
- Local Transactions
- The number of local transactions initiated by the server instance during the interval.
- Local Transactions Begun
- The number of local transactions begun on the server.
- Local Transactions Committed
- The number of local transactions committed.
- Local Transactions Involved
- The total number of global transactions involved at the server (begun and imported).
- Local Transactions Rolled Back
- The number of local transactions rolled back.
- Local Transactions Timeout
- The number of local transactions timed out.
- Lock Object Class
- The classname of the locked object. The valid form is an alphanumeric string, maximum 128 characters.
- Log File Name
- The Log File used by the Resource Adapter for a Connector Connection Pool.
- Logging Enabled
- The Log File used by the Resource Adapter for a Connector Connection Pool.
M
- Managed Space
- This is a term we use to describe the entire scope of what WAS can monitor. Since WAS can monitor servers and appservers, along with applications and J2EE components like EJBs, the managed spaces has many dimensions.
- Max Capacity
- The maximum capacity configured for a Connector Connection Pool.
- Max Inactive Interval
- The maximum time interval, in seconds, that a servlet container will keep a session open between client accesses.
- Maximum Active Sessions
- The maximum number of active HTTP sessions during an interval.
- Maximum Inactive Interval
- The maximum time interval, in seconds, that the servlet container will keep a session open between client accesses.
- Maximum Live Sessions
- The maximum number of live HTTP sessions during an interval.
- Maximum Method Records
- The maximum number of method entry/exit records maintained by the Application Monitor for a request. The records will be over written when they reach this value starting with the oldest. The default value is 10,000.
- Max Priority
- The highest rank assigned to a thread that determine its precedence in processing a request.
- Maximum Response Time
- The maximum response time, measured in milliseconds.
- Maximum Time to Acquire Lock
- The maximum time (in milliseconds) spent on each monitor lock. The valid format is a positive integer.
- MBean
- A custom MBean is a Java object that implements a specific interface and conforms to certain design patterns. These requirements formalize the representation of the resource's management interface in the MBean. The management interface of a resource is the set of all necessary information and controls that a management application needs to operate on the resource.
- MD5
- A unique numeric signature that is different for files whose contents are different, even if their creation dates and file names coincide.
- Memory Dump Diagnostic
- This feature is only applicable for platforms supported by MDD. Memory Dump Diagnostic analyzes either one single heap dump or analyzes and compares two heap dumps while searching for evidence of a memory leak.
- Memory Leak
- A memory leak is the gradual loss of available computer memory when a program (an application or part of the operating system) repeatedly fails to return memory that it has obtained for temporary use. As a result, the available memory for that application or that part of the operating system becomes exhausted and the program can no longer function. For a program that is frequently opened or called or that runs continuously, even a very small memory leak can eventually cause the program or the system to terminate. A memory leak is the result of a program bug.
- Memory Leak Candidate
- Java classes and objects that are likely to be causing a memory leak.
- Memory Leak Confirmation
- The Memory Leak Confirmation Report helps you detect memory leaks in the system. Try various comparison metrics until you determine the cause of the leak. If there is over 24 hours of data available, the report will show the last 48 hours. Otherwise, the report will display the last 60 minutes of data.
- Memory Usage
- The amount of memory being used by the JVM process.
- Message Back Out Count
- The number of backed out messages that failed to be delivered to the bean's onMessage method. Applies to Message Driven beans.
- Message Count
- The number of messages delivered to the bean's onMessage method. Applies to Message Driven beans.
- Message Dispatcher
- The Message Dispatcher sends out e-mails of performance reports and trap results, as well as SNMP messages.
- Messages Threshold Time
- The amount of time in the threshold condition since the last reset.
- Method
-
- A function defined in a class. A class can contain data and methods. Methods are operations that are performed on data.
- The type of HTTP request with valid values of Get or Post.
- The number of associated methods.
- Method Acquiring Locks
- The name of the method that accessed a monitor. The valid format is an alphanumeric string, maximum 128 characters.
- Method/Component Records
- Number of methods nested request events occurring inside the context of this event.
- Method Signature
-
- Methods may have the same name but accept different arguments. An example of a uniquely "callable" method would be classname+methodname+methodsignature.
- The name of the method including its signature (only the leftmost 512 characters are recorded).
- Method Trace
- A Method Trace is the path of execution for a request. The trace includes entry and exit for methods in the thread, as well as the entry and exit for any embedded methods.
- Method Trace Data
- Each Method Trace contains entry and exit records including the Method Name, Date, Time, Elapsed Time, and CPU Time.
- Metric
-
- The item you want to measure: Throughput per Second, Throughput per Minute, Throughput per Hour, Response Time, or CPU Time.
- The item you want to measure: Pool Size, Concurrent Waiters, Average Wait Time, Faults, Percentage Pool Usage, Physical Connections, Connection Handles, JVM Free Memory, and JVM Memory Used.
- Minimum Active Sessions
- The minimum number of active HTTP sessions during an interval.
- Minimum Life Sessions
- The minimum number of live HTTP sessions during an interval.
- Minimum Response Time
- The minimum response time, in milliseconds.
- MIPS
- Million Instructions per Second. This is an estimated computation to give an indication of the platform CPU power. This computation is based on an empirical formula derived from the SRM (System Resources Manager) service units/second factor.
- MOD
- Monitor on Demand.
- Monitor Level
- In the Application Monitor, the user has the ability to select between three levels of monitoring for a server or set of servers: L1 (Production mode), L2 (Problem Determination mode), and L3 (Tracing mode.)
- MQBACK
- A MQ API to back out a MQ transaction.
- MQBEGIN
- A MQ API to begin a MQ transaction.
- MQCLOSE
- A MQ API to close a queue.
- MQCOMIT
- A MQ API to commit a transaction.
- MQCONN(X) Average Response Time
- A MQ API to make queue manager connection.
- MQDISC
- A MQ API to disconnect a queue manager connection.
- MQGET Average Response Time
- The average response time of a MQ API to get a message from a queue.
- MQINQ
- A MQ API to inquire a queue attributes.
- MQOPEN
- A MQ API to open a queue.
- MQPUT(1) Average Response Time
- A MQ API to put a message in a queue.
- MQSET
- A MQ API to set a queue attribute.
- Stored Procedure
- A block of procedural constructs and embedded SQL statements that is stored in a database and that can be called by name. Stored procedures enable an application program to be run in two parts, one on the client and the other on the server, so that one call can produce several accesses to the database.
N
- No Local
- The noLocal Boolean for the durable subscriber.
- No Room for New Session
- The number of times that a request for a new session can not be handled because it would exceed the maximum session count.
- Number of Activates
- The number of times beans were activated (applies to Entity and stateful session beans).
- Number of Activations
- The number of beans made active.
- Number of Active Connections
- The current total active connections.
- Number of Active Connections High
- The peak number of active connections in a Connector Pool since the pool was instantiated.
- Number of Active Servers
- The current total number of alive servers in a cluster.
- Number of Active Transactions
- The number of active transactions on a server.
- Number of Allocates
- The total number of connections allocated.
- Number of Beans in Use
- The number of beans currently in use during the session (active or ready state).
- Number of Bytes Current
-
- The current number of bytes stored in the destination.
- The current number of bytes stored on the JMS server.
- The current number of bytes received by the durable subscriber.
- Number of Bytes High
- The peak number of bytes stored in the destination/JMS server since the last reset.
- Number of Bytes Pending
-
- The number of bytes pending (uncommitted and unacknowledged) by the consumer/durable subscriber/producer.
- The number of bytes pending (uncommitted and unacknowledged) stored on the JMS server or in the destination.
- The number of bytes pending (uncommitted or unacknowledged) for the session.
- Number of Bytes Received
-
- The number of bytes received by the consumer or the session since the last reset.
- The number of bytes received on the JMS server since the last reset.
- The number of bytes received in the destination since the last reset.
- Number of Bytes Sent
- The number of bytes sent by the producer or the session since the last reset.
- Number of Cache Accesses
- The number of times the cache has been accessed.
- Number of Cache Hits
- The number of times a bean is looked up and successfully found in the cache.
- Number of Cached Beans
- The number of beans currently cached.
- Number of Connection Consumers Current
- The current number of connection consumers for the session pool.
- Number of Connection Consumers High
- The peak number of simultaneous connection consumers for the session pool.
- Number of Connection Consumers Total
- The total number of connection consumers made by the session pool since the last reset.
- Number of Connections Created Total
- The total number of Connector connections created in this Connector Pool since the pool was instantiated.
- Number of Connections Destroyed Total
- The total number of Connector connections destroyed in this Connector Pool since the pool was instantiated.
- Number of Connections Matched Total
- The total number of times a request for a Connector connections was satisfied via the use of an existing created connection since the pool was instantiated.
- Number of Connections Rejected Total
- The total number of rejected requests for a Connector connections in this Connector Pool since the pool was instantiated.
- Number of Connections Total
- The total number of JDBC connections in the JDBCConnectionPoolRuntimeMBean since the pool was instantiated. The total number of connections made to the WebLogic Server since the last reset.
- Number of Consumers Current
-
- The current number of consumers accessing the destination.
- The current number of consumers for the session.
- Number of Consumers High
-
- The peak number of consumers accessing the destination since the last reset.
- The peak number of consumers for the session since the last reset.
- Number of Consumers Total
-
- The total number of consumers accessing the destination since the last reset.
- The total number of consumers instantiated by the session since the last reset.
- Number of Creates
-
- The number of times beans were created.
- The total number of connections created.
- The number of create calls.
- Number of Destinations Current
- The current number of destinations for the JMS server.
- Number of Destinations High
- The peak number of destinations on the JMS server since the last reset.
- Number of Destinations Total
- The number of destinations instantiated on the JMS server since the last reset.
- Number of Destroys
-
- The number of times bean objects were freed.
- The total number of connections destroyed.
- Number of Errors
- The total number of errors in a servlet/JSP.
- Number of Foreign Fragments Dropped
- The number of fragments that originated in foreign domains/cluster that use the same multicast address.
- Number of Fragments Received
- The total number of multicast messages received on this server from the cluster.
- Number of Fragments Sent
- The total number of multicast fragments sent from a server into a cluster.
- Number of Free Connections Current
- The current total free connections.
- Number of Free Connections High
- The peak number of free connections in a Connector Pool since the pool was instantiated.
- Number of Garbage Collection Calls
- The number of garbage collection calls.
- Number of Idle Beans
- The number of idle beans in a pool that are available for use.
- Number of instantiations
- The number of times the system creates the bean objects.
- Number of Invalid Login Attempts Total
- The cumulative number of invalid logins attempted on the server.
- Number of Invalid Login Users High
- The peak number of users with outstanding invalid login attempts for the server.
- Number of Invocation Total
- The total number of servlet invocations.
- Number of Leaked Connections
- A connection that was checked out from the connection pool but was not returned to the pool by calling close.
- Number of loaded servlets
- The number of servlets that were loaded.
- Number of Loads
- The number of times the system loaded bean data.
- Number of Lock Acquisitions
- The number of locks acquired.
- Number of Lock Acquired
- The number of monitor locks acquired by the method. The valid format is a positive integer.
- Number of Lock Contentions
- The number of monitor connections that have occurred. The valid format is a positive integer.
- Number of Lock Entries
- The number of entries that are currently locked.
- Number of Lock Managers Accesses
- The number of times the Lock Manager is accessed. It applies to the beans that have exclusive locking specified.
- Number of Locked Users Current
- The number of currently locked users on the server.
- Number of Login Attempts While Locked Total
- The cumulative number of invalid logins attempted on this server while the user was locked.
- Number of Managed Connections
- The number of ManagedConnection objects in use for a particular EIS product name.
- Number of Managed Connections Allocated
- The total number of connections allocated.
- Number of Managed Connections Created
- The total number of connections created.
- Number of Managed Connections Destroyed
- The total number of connections destroyed.
- Number of Managed Connections Freed
- The total number of connections freed.
- Number of Messages Current
-
- The current number of messages in the destination.
- The number of messages still available by the durable subscriber.
- The current number of messages stored on the JMS server.
- Number of Messages High
- The peak number of messages in the destination since the last reset.
- Number of Messages Pending
-
- The number of messages pending (uncommitted and unacknowledged) by the consumer/durable subscriber/producer. Pending messages are over and above the current number of messages. A pending message is one that has either been sent in a transaction and not committed, or that has been received and committed or acknowledged.
- The number of messages pending stored on the JMS server.
- The number of messages pending for the session.
- Number of Messages Received
- The number of messages received by the consumer/ the session or received on the destination since the last reset.
- Number of Messages Sent
- The number of messages sent by the producer/ session since the last reset.
- Number of Multicast Messages Lost
- The total number of incoming multicast messages that were lost according to the server.
- Number of Objects Allocated
- The number of objects allocated.
- Number of Objects Freed
- The number of objects freed.
- Number of Objects in Heap
- The number of instance data in storage.
- Number of Objects Moved
- The number of objects moved.
- Number of Online / Total
- The total number of CPU currently enabled.
- Number of Open Sessions Current
- The current total number of open sessions in the component.
- Number of Open Sessions High
- The peak number of the total number of open sessions in the server.
- Number of Open Sockets Current
- The current number of sockets registered for socket mixing on the server.
- Number of Open Sockets Total
- The total number of registrations for socket mixing on the sever.
- Number of Optimization
- The total number of global transactions converted to single phase for optimization.
- Number of Passivates
-
- The number of times beans were passivated (applies to Entity and stateful session beans).
- The number of times the system passivated (removed from memory) a bean instance.
- Number of Passivations
- The number of beans made passive.
- Number of Pending Requests Current
- The number of waiting requests in the queue.
- Number of Pending Requests Oldest Time
- The time that the longest waiting request was placed in the queue.
- Number of Persistence Loads
- The number of times bean data was loaded from persistent storage. This applies to entity beans.
- Number of Persistence Stores
- The number of times bean data was stored in persistent storage. This applies to entity beans.
- Number of Primary
- The number of objects that the local server hosts as primaries.
- Number of Ready Beans or Concurrent Actives
- The number of bean instances in ready state or method-ready state.
- Number of Reload Total
- The total number of servlets that were reloaded.
- Number of Reloads
- The number of servlets that were reloaded.
- Number of Removes
-
- The number of times beans were removed.
- The number of remove calls.
- Number of Resend Requests
- The number of state-delta messages that had to be resent because a receiving server in the cluster missed a message.
- Number of Restarts
- The total number of restarts for this server since the cluster was last activated.
- Number of Returns
- The total number of connections freed.
- Number of Second Active Transactions
- The total number of seconds for all committed transactions.
- Number of Serviced Requests Total Time
- The number of requests which have been processed by the queue.
- Number of Session Pools Current
- The current number of session pools instantiated on the JMS server.
- Number of Session Pools High
- The peak number of session pools instantiated on the JMS server since the last reset.
- Number of Session Pools Total
- The number of session pools instantiated on the JMS server since the last reset.
- Number of Sessions Current
- The current number of sessions for the connection.
- Number of Sessions High
- The peak number of sessions for the connection since the last reset.
- Number of Sessions Opened Total
- The total number of open sessions in this Web application component.
- Number of Sessions Total
- The number of sessions on the connection since the last reset.
- Number of Stores
- The number of times the system wrote bean data to the database.
- Number of Threads Dead
- The number of threads that died.
- Number of Threads Started
- The number of threads started.
- Number of Time-outs Total
- The total number of transactions that have timed out.
- Number of Total Connections
- The total number of JDBC connections in the JDBCConnectionPoolRuntime MBean since the pool was instantiated.
- Number of Transactions
- The total number of transactions processed. This total includes all committed, rolled back and heuristic transaction completions.
- Number of Transactions Abandoned
- The number of transaction that were abandoned.
- Number of Transactions Committed Total
- The total number of committed transactions.
- Number of Transactions Heuristic
- The number of transactions that completed with a heuristic status.
- Number of Transactions Rolled Back App
- The number of transactions that were rolled back due to an application error.
- Number of Transactions Rolled Back Resource
- The number of transactions that were rolled back due to a resource error.
- Number of Transactions Rolled Back System
- The number of transactions that were rolled back due to an internal system error.
- Number of Transactions Rolled Back Total
- The total number of transactions rolled back.
- Number of Transactions Timed Out Total
- The number of transactions that were rolled back due to a timeout expiration.
- Number of Unlocked Users Total
- The number of times a user was unlocked on a server.
- Number of User Lockout Total
- The cumulative number of user lockouts done on a server.
- Number of Waiters Total
- The number of times a thread requested and had to wait for a bean from the pool.
- Number of Waits for Lock
- The number of times that a thread waits for a lock.
- Number Waiting for Connections
- The current total number of threads waiting for a connection.
- Number Waiting for Connections High
- The peak number of threads waiting for a connection in the JDBCConnectionPoolRuntimeMBean. The count starts at zero each time the JDBCConnectionPoolRuntimeMBean is instantiated.
O
- Object
- An instance of a class.
- Offending Content
- Offending Value
- ORB
- Object Request Brokers. An Object Request Broker (ORB) manages the interaction between clients and servers, using the IIOP. It enables clients to make requests and receive responses from servers in a network-distributed environment.
- ORS
- Original Request String.
- Override Monitoring Level
- The selected monitoring level will override the current monitoring level (until the next scheduled monitoring level change or monitoring level override.)
P
- Per Method Concurrent Requests
- The number of concurrent calls to invoke the same method.
- Percent CPU Usage
- The average percentage the CPU has been busy since the last query.
- Percent Maxed
-
- The average percent of the time that all connections are in use.
- The average percent of the time that all threads are in use.
- Percent of Total Number
- The number of Java objects belonging to the same Java class and the total number of Java objects in the heap.
- Percent Time Max in Use
-
- The average percentage of time that all connections are in use.
- The percentage of time that the maximum configured threads are in use. If this value is consistently in the double-digits, then the Web container could be a bottleneck and the maximum number of threads available to the Web Container should be increased. See WebSphere documentation.
- Percent Used
- The average percentage of a pool that is in use.
- Plan Name
- The DB2 plan name used by a connection.
- Platform
- The application server product name.
- Platform CPU Delta
-
- The amount of CPU time that the operating system used since the last refresh. (This feature does not apply to z/OS Platform)
- The system highlights this number on the Server Statistics Overview page when the amount of CPU time that the operating system used since the last page refresh exceeds the threshold value.
- Platform CPU% Utilization
- The percent of the total CPU being utilized by the server platform.
- PMI Polling Frequency
-
- Performance Monitoring Infrastructure Polling Frequency.
- The number of times the system resources request information from the PMI in seconds.
- Pool Max Capacity
- The maximum capacity of the servlet for single thread model servlets.
- Pool Size
-
- The average pool size.
- The average number of threads in the pool.
- Pool State
- The pool state as one of "Active" or "Suspended".
- Port Number
- The port number of the server being sent SNMP messages.
- Portal
- A single, secure point of access to diverse information, applications, and people that can be customized and personalized.
- Portlet
- A reusable Web module that runs on a portal server. Portlets have predefined roles such as retrieving news headlines, searching a database, or displaying a calendar.
- Prepared Stmt Cache Discard Count
- The total number of statements discarded because the statement cache is at its maximum size.
- Priority
- A number assigned to the JVM thread.
- Processing Time
- The time (in milliseconds) it takes a registered portable interceptor to run.
- Projected Count
- The number of requests in the Detail report, after you divide by the Sampling Rate for each request. For example, if the Sampling Rate is 2%, each request in the Detail report will count as 50 in the projected count. Since sampling rates are different for each request in the Detail report, this value is computed line by line and then the sum is displayed.
- Publish Server
- Accepts data from a data collector and aggregates it based on different needs.
Q
- (None)
- There are no glossary entries that begin with the letter Q.
R
- Recent Activity
- A diagnostic tool that provides server activity analysis reports regarding memory.
- Recent Requests
- A feature that describes requests that have recently completed.
- Recycle Total
- The total number of Connector connections that have been recycled in this Connector Pool since the pool was instantiated.
- Reentrant
- A bean's reentrance policy (reentrant or not reentrant within transaction).
- Reference Lookup Time
- The amount of time (in milliseconds) taken to look up an object reference before method dispatch can be carried out.
- Registered EJBs
- The number of registered EJBs on an application server.
- Registered Servlets
- The number of registered servlets on an application server.
- Remote Active Sessions
- The number of active remote communication sessions attached and active within a server instance, during the interval.
- Remote Bytes Received
- The number of bytes transferred to the server from all remotely attached clients.
- Remote Bytes Sent
- The number of bytes transferred from the server to all remotely attached clients.
- Remote Existing Sessions
- The number of existing remote communication sessions at the end of the interval.
- Remote Host
- The host name of the client initialing the request.
- Remote IP
- The IP address of the client initialing the request.
- Request
- Request by a client for a particular server resource. This resource is often a Web page or a Java application.
- Request Name
-
- The name of the request submitted to the server.
- Enables you to assign alternate request identifiers that are more meaningful and appropriate to the chosen model of the application.
- Request Object
- The J2EE server converts an HTTP request to an HTTP request object and delivers it to the Web component identified by the request URL. The Web component fills in an HTTP response object, which the server converts to an HTTP response and sends to the client.
- Request Object Attributes
- The attributes bound to a request object.
- Request Sampling Rate
- The percentage of requests that will be stored in the database for reporting and analysis.
- Request Type
- The type of request, such as EJB, JSP, or servlet.
- Request URL
- The URL associated with a request.
- Requests
- The total number of times the servlet or JSP was requested during the interval.
- Resident Time
- The time a request has been active and served.
- Resource
-
- The resource selected for a trap, i.e., Occurrence, CPU time, Resident time, Wait time, SQL Resident time, HTTP request parameters, or SQL statements.
- The full name of an EJB.
- The full name of a servlet or JSP on an application server.
- Resource Adapter Link Ref
- The Resource Adapter Link Reference for cases where a Connection Factory refers to an existing Resource Adapter deployment.
- Response Time (ms)
- The response time (in milliseconds) of a request.
- Return Codes
- The value of the response code field in the CICS EXEC interface block (the value of RESP in an EXEC CICS call).
- Returns Discarded
- The number of times a returning object was discarded because the pool was full. This applies to entity and stateless beans.
- Returns to Pool
- The number of calls returning an object to the pool. This applies to entity and stateless beans.
- RMI
- Remote Method Invocation. A standard from Sun for distributed objects written in Java. RMI is a remote procedure call, which enables Java objects (software components) stored in the network to be run remotely.
- Role
- The administrator assigns a role to each user. The system default roles are Administrator, Operator, and User. The administrator can create custom roles to suit the needs of their specific environment.
- Rolling Date
- One of three options for specifying the baseline average response time on the Systems Overview pages. The number of days over which the average response will be calculated. The response times on the Systems Overview pages will be compared to these baselines.
- Run-time Environment
- The specifics regarding the set up and installation of a server. The Application Monitor provides details for three environments: System, Java, and application server.
- Run-time Exception
- The exception generated by an application during the normal operation of the Java Virtual Machine.
- Runnable
- The thread is active or executing.
S
- Sample Count
- The number of requests in the Detail report.
- Sample End Time
- The time that the last sample arrived.
- Sample Start Time
- The time that the system received the first sample.
- Sample Sum
- The total number of samples collected for a report period.
- Sampling Frequency
- The percentage of requests that will be stored in the database for reporting and analysis.
- Schedule
- A set of definitions of when a data collector will switch monitoring levels.
- Secondary Distribution Names
- The names of the remote servers (e.g. myserver) of which the local server is hosting secondary objects. The name is appended with a number to indicate the number of secondaries hosted on behalf of that server.
- Security Information
- The pathname where the Security Policy file is stored.
- Selector
-
- The selector associated with a consumer.
- A selector for a durable subscriber.
- Serializable Session Object Size
- The average size of session objects at session level, including only serializable attributes in the cache.
- Server Activity Display
- Tracks transactions and requests and provides detailed thread data for an application server at a specific point in time.
- Server Name
-
- The name of the server where the system captured data.
- The combination of the admin server name and the Application Server name and the process ID, or in the case of z/OS platform, the name of the Sysplex node, the application server name, and the address space ID of the server region.
- Server Names
- The names of the servers in a cluster.
- Server Overview
- This page displays comprehensive server information, activity, statistics, and resource data for a selected server.
- Server Region Name
- The name of the Server region which belongs to a server instance.
- Server Resource Trap
- A trap on system resource activity, as opposed to a user's application behavior.
- Server Scope
- The server(s) on which a report is generated.
- Server Session Usage
- The percentage of ServerSession pool in use. This applies to Message Driven beans.
- Servlet
- A Java application that runs in a Web server or application server and provides server-side processing, typically to access a database or perform e-commerce processing. Servlets provide a Java-based component-based, platform-independent method for building Web-based applications. It is a Java-based replacement for CGI scripts, Active Server Pages (ASPs) and proprietary plug-ins written in C and C++ for specific Web servers (ISAPI, NSAPI).
- Servlet Name
- The name of the servlet or JSP on an application server.
- Servlet Volume
- The number of times that servlet requests were sent to the application server.
- Servlet/JSP Activity
- The number of servlet/JSP calls made in the last hour, with a 5 minute refresh rate.
- Servlet/JSP Coverage
- The graphical representation of the most frequently accessed servlet/JSPs.
- Session Attributes
- The attributes bound to a session object.
- Session Create Time
- The time the server created a session.
- Session Created
- The number of HTTP sessions created.
- Session ID
- The ID associated with an HTTP session object.
- Session Invalidate Time
- The average time from when a session is invalidated until it is finished.
- Session Lifetime
- The average session life time.
- Session Object
- The session object is used to share information for one user across multiple pages while visiting a Web site. In other words, a session object is a way of retaining state for a normally stateless HTTP Web site. The J2EE container creates the session object when a client makes a request to the server. When the same client makes another request, the server finds the session object associated with that client and uses it.
- Session Invalidated
- The number of HTTP sessions invalidated.
- Shrink Count Down Time
- The amount of time left (in minutes) until an attempt to shrink the pool will be made.
- Shrink Period Minutes
- The Shrink Period (in minutes) of a Connector connection pool.
- Shrinking Enabled
- The shrinking of a Connector connection pool is enabled.
- Size of Live Objects on Heap
- The size of the Instance Data that is currently in storage.
- Size Percent of Total Size
- The total size of the Java objects on the heap size.
- SMF Data
- This feature provides detailed information from SMF records published periodically by WebSphere.
- Snapshot Date
- The date when the currently displayed data was frozen.
- Snapshot Time
- The time when the currently displayed data was frozen.
- SNMP
- Simple Network Management Protocol. A set of protocols for managing complex networks.
- Source Info
- An informative string about a component's source.
- SQL Call
- The SQL operation performed on a Table.
- SQL Statement
- The SQL statement that is currently being processed by the connection.
- SSL Listen Address
- Secured Socket Layer. The address on which the server is listening for connections.
- SSL Listening Port
- Secured Socket Layer. The secure port the application server uses to listen for requests.
- Stack Trace
- Displays a list of method calls starting with the method where the Stack Trace printed in a Last in First Out order. For each method, the class name, method name, and (optionally) a line number are displayed.
- Start Date/Time
- An ID assigned to a thread. The ID cannot be modified.
- State
- The state of a messaging bridge.
- Stateful Session Bean
- A session bean with a conversational state.
- Stateless Session Bean
- A session bean with no conversational state. All instances of a stateless session bean are identical.
- Status
-
- A string representation of a transaction's status.
- A component's status.
- Subscription Name
- The subscription name for a durable subscriber.
- Suspended
- A user paused the thread and can reactivate it when ready.
- System Paging Rate
- A paging file is a space on a hard disk used as the virtual memory extension of a computer's real memory (RAM). Having a paging file enables a computer's operating system to pretend that it has more RAM than it actually does. The least recently used files in RAM can be swapped out to the hard disk until they are needed later so that new files can be loaded into RAM. In larger operating systems, the units that are moved are called pages and the swapping process is called paging. Paging rate is referring to the rate of the swapping process in kilobytes per second.
- System Resources
- Displays the summary for all system resources usage information with a 5 minute refresh rate.
- System Resources Polling Frequency
- Set how often the managing server requests system resources information from the appservers. The default setting is 60 seconds.
T
- Table Name
- The name of the table affected by a SQL call.
- Target Type
- The metric used in a trap, e.g., DB Pool Size or CPU Time.
- Thread
- A thread enables multiple streams of execution concurrently and independently in the same program.
- Thread Create
- The total number of threads created.
- Thread Destroy
- The total number of threads destroyed.
- Thread Dump
- Detailed information of memory allocation of threads in a JVM.
- Thread ID
- ID assigned to a thread by the JVM when the thread is created. The ID cannot be modified.
- Thread Pool
- A pool of threads available for servicing client requests. The J2EE application server pre-creates a collection of threads. This collection is the pool. As new requests arrive to the server, it assigns a free thread to a request. When the request completes, the thread is returned to the pool.
- Thread Stack
- A list of methods currently being executed in a thread. In a thread, method A invokes method B that invokes method C, the stack is A->B->C. When C finishes, it becomes A->B.
- Thread Status
- Suspend status denotes that an operator suspended a thread, while Active status denotes an executing thread. To return a thread to active status, select Resume.
- Thread Type
- The types of thread, such as JSP, EJB or Servlet.
- Thread's Priority
- The priority of an active thread.
- Threshold
- A value against which server activity is compared. The system will send alerts when the actual value exceeds the threshold.
- Throughput (response / min, Last Hour)
- The amount of transactions / requests being transmitted in a given period of time, with the response time per minute of a server to process a transaction in last hour.
- Time Since Last Activated
- The time difference, in milliseconds, of the previous and current access time stamps. This does not include sessions timed out.
- Top CPU Intensive Methods Report
- A report that displays the most popular unique methods that, during the report period, took the most cumulative CPU time and the sum total CPU time. Displays up to 100 records.
- Top CPU Intensive Requests Report
- A report that displays unique requests that, during the report period, took the most cumulative CPU time and the sum total CPU time. Displays up to 100 records.
- Top Method Used Report
- A report that displays the most popular unique methods used during the report period, and how often each request was used. Displays up to 100 records.
- Top Request Used Report
- A report that displays the most popular unique requests used during the report period, and how often each request was used. Displays up to 100 records.
- Top Slowest Methods Report
- A report that displays the top unique methods that took the longest time to complete and the average completion time. It displays up to 100 records.
- Top Slowest Requests Report
- A report that displays unique requests that took the longest time to complete, as well as the average completion time. Displays up to 100 records.
- Top SQL Intensive Methods Report
- A report that displays unique methods that made the highest sum total of SQL calls during the report period. Displays up to 100 records.
- Top SQL Intensive Requests Report
- A report that displays unique requests that made the highest sum total of SQL calls during the report period. Displays up to 100 records.
- Top SQL Used Report
- A report that displays the five SQL call types that were most often called, as well as the number of calls during the report period.
- Top Tables Used Report
- A report that displays the tables that were called most often, as well as the number of times each table was called during the report period. Displays up to 100 records.
- Total Acquisition Time
- The amount of time spent acquiring a lock.
- Total Contention Time
- The total time (in milliseconds) spent on monitor contention. The valid format is a positive integer.
- Total CPU%
-
- The percentage of time that the entire platform was using CPU.
- The system highlights this number on the Server Statistics Overview page when the total CPU usage exceeds the threshold value.
- Total GC Time
- The total time of a routine that searches memory to reclaim space from program segments or inactive data.
- Total Memory
- The total memory in JVM runtime.
- Total Method Calls
-
- The number of calls to a bean's remote methods.
- The total number of methods being processed. A measure of server activity.
- Total Method Count
- The total number of methods being processed by the selected request.
- Total Requests
-
- The total number of requests sent to ORB.
- The total number of requests a servlet processed.
- The total number of times the Servlet or JSP services made a request during the interval.
- Total Resident Time
- The total amount of time, in milliseconds, since the start of the request.
- Total Sessions
- The total number of HTTP sessions tracked by the server at the interval. Includes both active and inactive sessions.
- Total SQL Used
- The SQL call types that were most often called, as well as the number of calls.
- Total Thread Count
- The total number of active requests being serviced by the selected application server.
- Total Time to Acquire Locks
- The total time (in milliseconds) spent on monitor lock. The valid format is a positive integer.
- Total Volume
-
- The number of completed requests.
- The system highlights this number on the Server Statistics Overview page when the total number of completed requests exceeds the threshold value.
- Transaction Failure Rate
- The percentage of transactions handled by the application server that did not successfully complete.
- Transaction Policy
- The bean method's transaction policy: TX_NOT_SUPPORTED; TX_BEAN_MANAGED;TX_REQUIRED; TX_SUPPORTS; TX_REQUIRES_NEW; TX_MANDATORY; TX_NEVER.
- Transaction Server Name
-
- The name of the Sysplex.
- The name of the WebSphere Server.
- Transaction Supported
- The transaction support level for the Resource Adapter for a Connector connection pool.
- Transaction Volume
- The number of times that transactions were executed on an application server.
- Trap
- A set of conditions, thresholds, and criterion set by the user, which, when met, trigger actions.
- Trap Action History
- Whenever a trap triggers an action, a record will be placed in this page.
- Trap Condition
- The user-defined criteria that is part of a trap definition.
- Trap Type
- A way of categorizing two different types of metrics used to define traps application traps or server resource traps.
- Trend Report
- A report that displays the results of the defined data set. To view the detailed report broken down by different criteria, choose an option from the Additional Detail drop-down menu, and then click the data points.
U
- UUID
- Universally Unique Identifier. An identifier for each symbol in an activity diagram.
- Unique Request
- All the instances of a specific request string.
- Uptime
- The amount of time, in seconds, the JVM has been running.
- Used Memory
- The used memory in the JVM runtime.
- User Name
- The database user name that is used for creating a connection.
V
- Volume Delta
-
- The number of completed requests since the screen refreshed.
- The system highlights this number on the Server Statistics Overview page when the number of completed requests since the last refresh exceeds the threshold value.
- Volume Throughput
- The amount of data being processed in a specified amount of time.
W
- Wait Seconds High Count
- The number of seconds the longest waiter for a connection waited.
- Waiting Condition
- The thread is waiting on a condition variable.
- Waiting Monitor
- The thread is waiting on a monitor.
- Web Container
- Handles requests for servlets, JSPs, and other types of server-side include coding. The Web container creates servlet instances, loads and unloads servlets, creates and manages requests and response objects, and performs other tasks for managing servlets effectively.
- Web Session Browser
- This feature will provide session information for one server or multiple servers and will enable you to find a specific session across one or more servers.
- Web Server Overview
- Displays information about the performance of Web servers.
- Web Services Request Type
- This is the Web Services transactions in and out of the application server. Support includes JAX-RPC over SOAP/HTTP and SOAP/JMS.
- WLM
- Workload Manager.
- WLM Associated Service Class
- This page offers a way to view selected data from the Workload Manager for z/OS and OS/390 , for the address space associated with a particular server, as well as its associated service class data and service class period data.
- WLM Associated Service Class Period
- This page displays the response time distribution detail and delay detail information about each subsystem work manager.
- Worst Performers
- The 5 worst performing EJBs and Servlets. Worst Performing is defined as the slowest response time.
X
- (None)
- There are no glossary entries that begin with the letter X.
Y
- (None)
- There are no glossary entries that begin with the letter Y.
Z
- (None)
- There are no glossary entries that begin with the letter Z.