IBM Automated Problem Determination Tool
User's Guide Version 1 Release 2.2.2
Start the Tool in GUI Mode on Windows
To start the AutoPD tool in a Windows environment, go to the RasGUI folder and run the runAutoPD.bat batch file contained in this directory. For this batch file to complete properly, it must in turn execute the...
%WAS_HOME%\bin\setupCmdLine.bat...batch file to set the %JAVA_HOME% environment variable. For a typical WebSphere Application Server or WebSphere Portal install, runAutoPD.bat automatically finds this second batch file and executes it. If runAutoPD.bat cannot find this second batch file, run it manually...
cd %WAS_HOME%\bin
setupCmdLineOnce you have done this, runAutoPD.bat will complete successfully, and the tool will start in GUI mode. Starting the Tool in GUI Mode on Linux, AIX, HP-UX, and Solaris
To start the AutoPD tool in a Linux, AIX, HP-UX, or Solaris environment, go to the RasGUI directory and execute the runAutoPD.sh script contained in this directory. For this script to complete properly, it must in turn execute...
$WAS_HOME/bin/setupCmdLine.sh...to set the $JAVA_HOME environment variable. For a typical WebSphere Application Server or WebSphere Portal install, runAutoPD.sh automatically finds this second script and executes it. If runAutoPD.sh cannot find this script, run it manually...
cd $WAS_HOME/bin
./setupCmdLine.shOnce you have done this, runAutoPD.sh will complete successfully, and the tool will start in GUI mode.
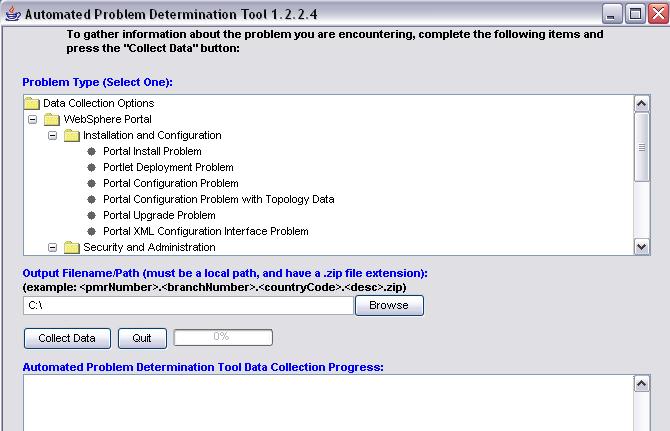
Select a Problem Type to debug and then enter a filename for the data collection zip file. The filename can be anything you want: the tool will automatically append the .zip suffix. If you a debugging a problem with an IBM Support Center PMR, use a filename such as...
<pmrnumber>.<branchnumber>.<countrycode>.<short description>.zipFor example...
34143.055.000.logs.zipThe next step is to press the Collect Data button. As it proceeds, the collection script will ask you for any additional information it needs to complete its collection activities.
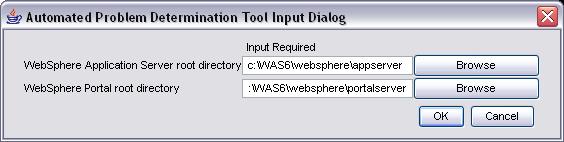
Most WebSphere Portal scripts ask for the WebSphere Application Server and WebSphere Portal root directories, as well as for whether the WebSphere Portal for which you.re collecting data is running as part of a cluster. A script may also ask you for additional configuration information, for information about the sequence of events leading up to the problem you are dealing with, or for the preferences regarding how it should complete the collection. Once it has all the information it needs, the script will proceed with the remainder of the collection.
For some WebSphere Portal collection scripts, the AutoPD tool must reset the trace levels for a portal instance to the appropriate values for a particular problem type. For WebSphere Portal version 5, resetting these trace levels requires the tool to stop and restart the portal instance. Before it does this, it will ask you whether you are prepared to have the portal instance recycled in this way. If you answer "No". some scripts will terminate the entire collection at that point, since nothing of value can be obtained without recycling the portal instance. Other scripts, however, will proceed to collect the log files that already exist, since these files may contain sufficient data to diagnose the problem.
WebSphere Portal version 6 introduces a new capability to reset trace levels in a running portal instance without recycling it. You may, however, prefer to recycle the portal instance, even in a WebSphere Portal version 6 environment. The collection scripts let you choose how you would like to reset traces in this case: with or without recycling the portal instance.
If you answer "Yes" to the question about recycling the portal instance, the tool will do this, and then pause while you reproduce the problem. Alternatively, if you choose to reset trace levels in a WebSphere Portal version 6 environment without recycling the portal instance, the tool will do this, and then pause while you reproduce the problem. In both cases, the tool will then complete the data collection and analysis operations, and FTP the results to IBM Support if you indicate that you want it to do this. Finally, the tool will put WebSphere Portal back into the state it was in when the script began: with its previous trace levels and other configuration settings and (with one exception) the server either started or stopped depending on which of these states it was in before.
The one exception to this rule is the case where you initially requested that the trace levels be reset without recycling the portal instance, but then allowed the tool to recycle it when you were informed that it was not currently started. In this case, the collection leaves the portal instance in the started state, on the theory that this is the state you had believed it was in. If we need the portal instance to be returned to the stopped state, we can do this manually after the collection has completed.
The name of the zip file the tool sends to IBM Support via FTP will be the filename entered in the Output Filename/Path box, with the server hostname and current timestamp appended to it.