Back
WebSphere Portal V6 Enterprise Scale Deployment
- Overview
Overview
The goal of performance testing is to...
- Evaluate the total system throughput against a predefined set of performance goals
- Identify the low-performing part of the system
- Execute tuning steps to bring overall satisfactory performance results
Functional test of a new installation
Before deploying custom code or configurations to the environment, perform a thorough functional check of the new installation.
- Check that all necessary WAS and WPS fixes have been installed
- Do all starting performance tuning according to the Performance Tuning Guide, especially basic things such as heap size
- Start the Deployment Manager and nodeagent if they were down, and check that the logs are free from exceptions
- Start portal server from the Deployment Manager console, and verify that there are no exceptions in the SystemOut.log
- Log on to portal with the administrator user id, go to the administrative pages, add a new page, verify that the new page is visible
- Create new user and, verify that the new user can log in but cannot view the administrative pages
- Log on to portal with the administrator user id, assign the new user to the portal administrators group (wpsadmins), verify that the new user can log on to portal and now sees the administrative pages
- [HA] Bring down one node of portal in the cluster, assuming there is more than one node in the cluster, verify the portal is still accessible
- [HA] Bring down one node of the database server, assuming that there is High Availability on the database servers, verify portal content is still accessible
10.[usability] Bring down all portal nodes or all database nodes, verify web server returns something informational saying that the site is down instead of an unhelpful 404 error
Plan for Performance testing and tuning
Portal out of the box is tuned so that it will run in any environment - from a 32-way processor “Big Iron” UNIX machine with 48 GB of RAM to an old laptop with 1GB of RAM and a single processor not worth mentioning. The initial tuning parameters are set so that, on any hardware, it will install, it can be configured, and we can log into it. It is not tuned for large numbers of users, and it is not tuned to take advantage of the powerful hardware that we purchased for it to run on.
Create a production-like environment and set aside several weeks in the deployment schedule for tuning.
You should have run performance test of the default portal install as soon as it was configured, but without any portlet code or customizations. Before we do any tuning at all, run another performance test with all of the portlet code, page layouts, security and customizations in place. This will give we an idea of the impact of the customizations to the portal environment and its impact to performance. Monitor every aspect of the system - the database servers, LDAP servers, Portal Servers, web servers, policy servers for single sign-on. If the portlets access any other back-end servers, monitor those too. Any one of these could be a bottleneck to overall performance if not tuned properly.
The next step is to go through the WebSphere Portal Performance Tuning Guide published by IBM and apply the basic tuning parameters suggested. Not all of the suggested values will be correct for the environment, but we can use them as a starting point and a reference guide of the most important parameters to look at. Run performance tests between each change to gauge the impact of each parameter as we learn how each one affects the environment. Keep an eye on all of the integration points for any spikes in resource utilization and resolve any bottlenecks as they appear.
The following sections outline key best practices in planning and implementing a successful testing strategy for the Portal implementation.
Plan the test
Successfully planning performance tuning and testing of the Portal solution requires thorough knowledge of all aspects of the environment: user.base.attributes, login
- Performance testing should have equal importance to development and functional testing when planning and scheduling release cycles
- Performance testing should start as early as possible
- Performance testing should be given enough time and resources
- Designate a single person to be the focal point for performance testing
- When there is a performance problem, there should be a defect opened and tracked as if there were a functional problem
- Performance focal point person will be responsible for following up with portal system maintenance after the Production portal starts operations
- Do not use LPAR on performance test environment unless it is also used in the Production environment
- Apply tuning parameters before running the first portal performance test
- Use scripts to automate basic performance tuning changes to ensure consistency across environments
- Check testing script to make sure it covers login, navigational, administrative, public and private pages, reload performance, with realistic think times, login patterns
- Use incremental testing approach to execute the performance tests
- Monitor backend system utilization and raise concerns if there is an alarming usage of backend resources -even if overall performance results are acceptable
Establish consistent hardware/software setup
The goal of performance testing is to use load generation techniques and measurements to predict the performance behavior of the production environment under various loads. Therefore, the Performance testing environment should be an exact replica of the Production environment. The hardware and software profiles must be consistent in order to have an accurate prediction of the behavior of the production environment. In particular, the following specifications should be as close as possible.
- Hardware type (RS/6000, Sun, iSeries, Intel)
- CPU speed and architecture (32big vs. 64bit, LPAR vs. non-LPAR)
- Memory size and speed
- Software levels (OS, middleware, WAS and WP version and patch levels)
- Cluster status of Portal (clustered vs. standalone, horizontal vs. vertical clones)
If we are planning on supporting a large number of users with a large horizontal cluster, it is acceptable to scale back the number of nodes in the performance testing environment. For example, if the infrastructure plan is for a 6-node portal cluster, we can build a 2-node portal cluster for the performance testing environment. A performance test run against the performance testing environment with 200 users would predict performance behavior of an actual production load of 600 users.
Apply base tuning parameters
Note: Don’t forget to tune all parts of the environment -Database, LDAP server, and
HTTP server and firewalls all can have significant impacts on the overall performance!
Portal Server tuning parameters
Refer to the WP performance tuning guide for complete guidelines on tuning the WP 6.0 environment:
Here are some important values to consider:
Table 6-1 Portal server tuning parameters
Property Impact JVM Heap size Too big will cause long Garbage Collection (GC) time. Too small will cause frequent GC, or paging, or in some extreme cases, out of memory exception. Nursery size: MaxNewSize NewSize Increase the nursery size to approximately 1/4 of the heap size, but not more than 1/2 the full heap. The nursery size is set using... XX:MaxNewSize=128m, XX:NewSize=128mToo large will cause longer, less frequent GC time
Too small will increase time spent in memory allocation
Session Timeout Too long will cause too much memory usage due to many concurrent sessions are both saved in memory Too short will cause negative user experience. Servlet thread pool size Too large will overload the CPU Too small will limit throughput Class GC Whether to encourage class reuse or not Enable Pass-by-reference Whether EJBs can be passed by reference WPS configuration datasource
WPS release datasource
WPS customization datasource
WMMdb datasource
JCRdb datasource
FDBKdb datasourcepreparedStatementCache size - too big will use a lot of memory, too small will cause extra overhead for each statement execution ConnectionPool size - too big will increase load on the database server, too small will cause poor throughput
Also notice that each datasource can be tuned independently - allocate resources according to the usage of portal features:
- WPSdb contains portal configuration and security
- WMMdb contains user data, including lookaside or db-only security information
- JCRdb contains WCM and PDM content and stores personalization rules
- FDBKdb datasource contains Personalization and LikeMinds usage data
It is also important to consider the cache strategy and how we can tune portal’s Cache Manager Service to reflect an appropriate amount of caching for the usage of resources in the environment. The available caches and how to configure them is well documented in the WebSphere Portal 6 Tuning Guide.
Web Server tuning
Your web server sits between the Portal Server and the client (browser) requests. If not tuned for the expected user load, it can become a major bottleneck and impede performance. The following chart highlights some of the most important parameters to consider:
Table 6-2 Web Server tuning parameters
Property Impact ThreadsPerChild ThreadLimit More threads allowed will mean more connections, but also more CPU power and memory used. Set this to a reasonable value to find the balance between CPU utilization and best throughput. ThreadLimit is the max value that ThreadsPerChild can reach.
Property Impact MaxClients Maximum number of concurrent requests that can be handled. Any concurrent connection request over this limit will be queued (see below for restriction). ServerLimit ServerLimit and ThreadLimit together set the maximum configured value for MaxClients
Database tuning
WebSphere Portal server stores all runtime configurations in portal databases. Portal can generate a very large number of DB queries: if there is a bottleneck accessing any of the portal’s underlying databases, it can have a significant performance impact.
LDAP server tuning
Connections are made into the LDAP server by the security components of portal frequently for authentication and authorization purposes, especially during the login sequences. The design and structure of the LDAP server can have a significant impact on performance, especially for group memberships.
In particular, enabling support for nested groups can impact performance, especially if the LDAP server has a lot of deeply nested groups. Using dynamic groups or a very large number of groups also can have a performance impact unless the LDAP supports (and we configure portal to use) a user attribute to determine group membership rather than spidering group memberships to find the current user (for example, setting the groupMembershipAttributeMap to ibm-allgroups:all in the case of Tivoli Directory Server LDAP).
Run baseline performance tests before deploying the applications
As soon as we have completed the base portal install and configuration of the Performance testing environment, and applied the initial tuning parameters as indicated for the environment and applications in the WP Performance tuning guide, but before we deploy any of the applications, run a baseline performance test of the environment.
Scripting performance tests
The goal of performance testing is to measure portal performance metrics under certain portal usage scenarios. The web-based application performance test is usually executed using scripts on a load generator tool (such as Rational Robot or LoadRunner) to simulate workload with virtual users (vusers).
Performance metrics
There are two major performance metrics that can be used to evaluate portal application performance: response time and throughput. Response time is the time required to complete a unit of work (such as a page load). Throughput is the total units of work per period of time (measured in seconds of minutes). Both metrics must be considered to set performance test scenarios. Portal applications share some of the common web application characteristics, and it also has its own unique characteristics.
In a portal server context, throughput is commonly treated as how many page views per second can be served. The response time is the time required for portal server to completely render the portal page per user workload (a http request). Because the portal server is an aggregator of multiple applications on the same page, and it also integrates multiple enterprise services such as security (authentication and authorization), consider the following scenarios:
Login performance The time it takes from when a user enters their userid and password until the first portal page is fully rendered. Usually, this is the total time taken for user authentication and the first portal page rendering. The second part usually requires extensive computing. Before the portal server shows the first page, depending on the portal theme and portal access control model, it will need to decide what pages or links this current user is authorized to access and dynamically show or hide the links. This process includes multiple backend calls such as LDAP and Database queries and it is likely to see worse performance when there is backend service contention. Navigational performance The time it takes for a regular portal users to navigate from one portal page to another page when the user clicks on a page link. This activity usually involves a lot of database reads to load configuration data from the database. This performance depends heavily on database read throughput. Administrative performance The performance measurement for a portal administrator to login and navigate. By nature, a portal administrator is able to access more portal resources, and most of the operations of a portal administrator are to change portal configurations which involves a lot of portal database writes and as a results of more access control computing and heavy database writes (which are more expensive than reads), it is possible that administrator performance is worse than normal user viewing performance. You need to consider whether it is important to measure administrative performance. Public pages vs. private pages Portal server allows we to set pages to be publicly viewable (not requiring login) and these pages can take advantage of different levels of caching (at the web server, proxy server, client, etc.). The performance measurement results can be very different for public or private pages. Reload performance After a Portal Administrator has made configuration changes, it may take some time for regular users to see the changes. You may want to consider measuring how responsive the portal in reloading portal resources.
Building scripts
Knowing what to measure is not enough; we also need to consider how a normal portal user is gong to interact with the portal server. If the real world behavior is different from the test scenario, hardly any conclusions can be drawn from the results. The following are some best practices to simulate user behavior:
Assign unique user login per virtual user
You recommend that the load generator scripts assign a unique portal login user id to each virtual user (vuser) in the load generator. When two or more user sessions log in using the same user id and the two session both have configuration changes that need to be saved to the database, it will cause a lock condition in the database, and this will severely degrade portal server performance. To ensure such uniqueness, we can do one of the following:
- Have a large pool of portal user ids so that each vuser can randomly pick one user id, we recommend having a user id pool that is 25 times the total number of vusers used by the load generator tool. For example, if we have 100 vusers, then prepare a pool of 2500 user ids in the LDAP server. Also, make sure that the load generator script always picks the id from the pool randomly (rather than sequentially from the top of the list).
- Assign a dedicated unique portal user id to each vuser. For example, vuser1 will always use user id “wpsuser1” to log in. This is less realistic, but will guarantee uniqueness.
First time login or repeating user login
This is related to the point made above; the login performance measurement will be different depending on whether this is the first time the user has logged in or whether this is a repeating login of the same user. Your performance script should consider this. You might want to test two different scenarios depending on the business requirements.
Do not use hardcoded URLs in the scripts
Since version 5.1, Portal URLs can no longer be parsed or composed on the client side. The URL is always dynamically generated to include the encoded format of portal page state. Your script should always get the URL from the retrieved portal html page to determine the next link location. Test scripts should not contain any hardcoded URLs except the entry point (the first URL).
Use an appropriate think time
Think time is the time period in between simulated user clicks (between each generated load request). The suggested think time is 10-15 seconds. We can reduce the think time to generated higher load (requests per second), but there is a boundary to this approach. Notice the following:
Requests per second = # of concurrent users / (avg response time + avg think time)
This means that there is an upper limit of
requests per second = # concurrent users/avg response time
To achieve this, the average think time would have to be 0, which is not possible. Assume we have 100 concurrent users (vusers) and the average portal response time is 1s. Then we cannot have more than 100 requests per second. This is another common pitfall in that people confuse requests per second with the number of concurrent users. The number of concurrent users is normally the size of the vuser pool. These users will be concurrent over a long period of time (hours) while requests per second is a calculated value that represents the number of requests that can be handled by portal server within a short period of time (a second). When we make performance goals, remember that people are more likely to be concerned about the number of concurrent users instead of requests per second.
Script user logouts realistically
Considering the current user population: does every user log off when they are done with the portal application, or do they never log off explicitly but just close the browser window. In the latter case, the server session for this client will stay in memory until it reaches the session timeout value. If most users don’t log off, consider reducing the session timeout value in the JVM settings for portal.
Warm up the portal
When the portal server (or any other application server) is restarted, most of the caches will be rebuilt from scratch and it takes some load to populate the caches with a reasonable amount of data before the cache is sufficiently populated to improve performance. It is recommended that before each performance test, we run some load on the server to populate the cache entries and gain realistic test results.
Testing scenarios
At a minimum, performance testing should address the following two scenarios: achieving maximum throughput and an endurance run.
Table 6-3 Testing scenarios
Maximum Throughput Endurance Run Definition Use the load generator to ramp up the load over predefined intervals until the server has reached the heaviest portal server traffic based on the business requirements during a relatively short period of time. Use the load generator to simulate constant load on the portal server over a long period of time. Load profile Variable load: Rapidly increasing load. Stop when performance exceeds acceptable goals (for example, login time > 5 seconds) Constant load: Expect the performance to stay constant. Stop when performance starts to degrade Length Usually between 1 and 5 hours Usually several days to a week Goal Test the maximum system capacity. Any performance enhancement or degradation can be seen Test the overall system stability to reveal problems such as memory leaks.
Setting goals
Once we understand the unique performance metrics that relate to portal, and we understand the behavior patterns of the user population, we can set performance goals based on the business requirements and historic performance data.
The best practice is to keep the goals realistic and to accept average or percentile values. For example, the following is a typical realistic performance goal:
Achieve 50 requests per second with response times of<2 seconds in average for navigation<4 seconds for login requests
And have 50 requests per second withaverage WebSphere Portal CPU utilization <50% average DB2 server CPU utilization < 20%
With the following portal statistics1000 total page count200 concurrent portal users
Executing the test
Establish baseline performance
This step is necessary to prepare tests on a new portal installation or when the portal system has undergone major changes (such as moving from WP 5.1 to WP 6.0 or changing back-end database or LDAP server). The philosophy behind this test is to detect and fix and base portal configuration problems as early as possible. If the base portal system has some issues, no matter how well-performing the custom portlets are, the overall load testing will not yield satisfactory results. The earlier we can find base portal system tuning problems and fix them, the greater savings we can gain overall in the performance testing cycle.
Start this test by ensuring that the bare-bones portal installation has good performance by itself. The portal server should be installed and configured. If we are using a SSO application such as Tivoli Access Manager or SiteMinder, security should be enabled so that the SSO login challenge is in use. Before installing any custom code, including themes and skins, create an empty portal page with no portlets as a landing page so that it becomes the default page that virtual users will see after logon. Run a basic login performance load test to make sure that this system is able to render acceptable login response times under the desired load.
If portal performs poorly at this point, check to verify the basic tuning of all systems has been completed, including portal, web server, database, LDAP, and the SSO solution. If investigation shows very high CPU utilization under heavy load, we might need to evaluate the hardware specification. Rerun the test as necessary as we change tuning parameters until the base portal login time is satisfactory.
Deploy applications one at a time and retest
Rather than deploying the entire portal configuration and application suite into performance all at once, deploy application code in stages and retest. This approach is particularly valuable for a team who is not familiar with portal performance testing. Deploy custom content (themes, skins, portlets and pages) in an iterative fashion: start small and then add one or two features or change one or two parameters at a time, run the test, and only add more if it passes the test.
TIP: Do not add too many new features or change too many parameters between tests. The more changes we have between tests, the more difficult it is to isolate the problem and resolve it.
One frequent asked question is “If I follow the portal deployment approach outlined in Chapter 7, “Configuration Management: Moving between environments”, the entire portal solution will be moved from the UAT environment using ReleaseBuilder. How do I achieve this incremental test strategy?” You recommend that when a new portal application is introduced to the Performance Testing Environment (PERF), do not use ReleaseBuilder or a full XMLAccess export for the initial deployment. Instead, use XMLAccess to selectively export and import individual component resources into the PERF environment, run performance tests and make tuning or code fixes if necessary. After each individual deployment, if performance is satisfactory, then deploy more resources, otherwise, refer to 6.4.4, “Monitoring: what to monitor?” to troubleshoot. Because the scope of change between each incremental deployment is fairly small, it is straightforward to identify any performance issues as they come up.
After the entire system performs well, in the Performance Testing Environment, perform the following steps to ensure that nothing was missed:
- Apply to the source (UAT) portal environment all of the tuning and code fixes that were introduced for each performance tuning step.
- Clean up the PERF environment portal. Use ReleaseBuilder to move all resources from the UAT portal environment.
- Perform a final regression performance test on the integrated solution on the Performance test server.
If custom code fixes were needed, ensure that the changed code is checked back into the version control system. If there were portal configuration changes, the corresponding xmlaccess or wsadmin scripts should be updated and checked back into the version control system so that changes aren’t lost in future environments.
Analysis and comparison to baseline
There are two levels of baseline performance statistics that can be used:
- Legacy application performance measurements. If the portal application was converted from an existing J2EE application, the natural expectation is to compare portal application performance with the legacy application performance. While this is an important metric due to the fact that the users will be switching from the legacy application to the portal application, the reality is that due to the added computing cost of the portal presentation layer, it is possible that the performance measurements of the portal application for both throughput and response time, may be worse than that of the legacy J2EE application. You suggest using this baseline as a loose reference rather than a strict rule.
- Initial performance measurements of the base portal. This baseline is more meaningful to performance testing and tuning. After each incremental deployment and adjustment step, take performance measurements and compare them to the baseline results. This will provide more direct feedback on the effects on performance of the custom code. You suggest that we use this baseline as the main one for comparison and analysis.
Monitoring: what to monitor?
Monitor the following touch points and verify there is no contention of resources before approaching 100% of CPU utilization on the portal server. Monitoring provides key evidence used in troubleshooting portal performance problems.
- CPU monitoring involves monitoring the utilization in percentage during the load test.
CPU utilization should be monitored on the Portal server, the web server, the database server, the LDAP server, and on the load generator.
If the CPU utilization reaches 60% or greater on the load generator machine, we may have a bottleneck on the load generator itself, rather than somewhere in the portal solution. If that happens, we may want to add another load generator.
- File I/O is measured in disk read/write in bytes, and can also be a factor for performance.
File I/O should be monitored on the Portal server, the web server, the database server, the LDAP server, and on the load generator.
If we see a lot of expensive disk I/O on the portal server, check to make sure that logging and tracing is turned off. SiteAnalyzer also will log an entry for each portlet access, and the web server will log every http request in access.log.
On the database and LDAP servers, disk I/O speed is mission critical. If possible, write logs to separate hard drives.
- The network should be monitored for problems.
If packets are dropped between servers in the portal environment, it can have a significant negative impact on performance. Use the ping command to determine that there are no packets being dropped.
Note that ping only checks UDP packets. Use network tools to monitor TCP traffic performance.
Check the network between the following servers;
- portal server and the database server
- portal server and web server
- portal server and LDAP server
- http server and load generator
- http server and portal server
- database server and portal server
- LDAP server and portal server
- load generator and portal server
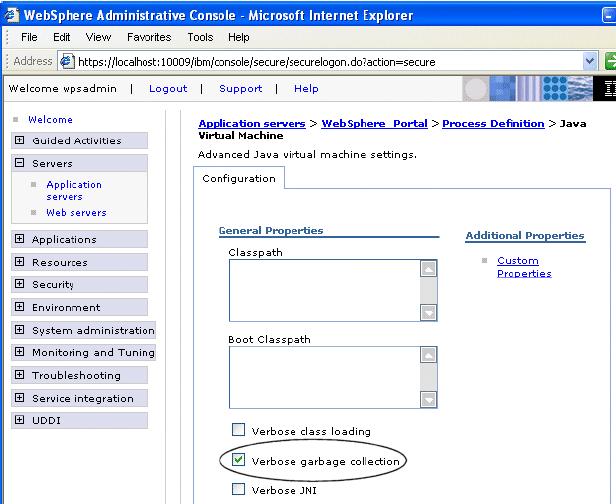
- Monitor JVM memory utilization, thread status, and database connection pools.
These can be monitored using JVM logs, java thread dumps and Tivoli Performance Viewer.
When we turn on verbose garbage collection (GC) on the portal JVM, it generates GC event logging in...
WebSphere/PortalServer/log/native_stderr.log
Monitoring database performance
WebSphere Portal Server stores configuration, access control, such as user identities, credentials, and permissions for accessing portal resources, and user data in a database. The performance of the underlying database(s) is critical to overall portal performance, therefore, monitoring and tuning the performance of the database is critical to WebSphere Portal performance testing.
There are two sides to monitoring database performance:
- Portal server side database performance
- Database side performance
Portal server side performance monitoring is done using Tivoli Performance Viewer, which is included with WAS, or using a tool such as Wily Introscope or Wily Portal Manager.
When monitoring performance from the portal server side, the following three metrics are most important:
Time spent executing database calls Time required for issuing database queries. This value should normally be <35ms. Connection pool average wait time Should be close to 0. Otherwise, it means that the database pool is likely too small, causing many connections to wait. Connection pool Prepared statement cache discards Prepared JDBC query statements are stored in JVM memory, reducing CPU load on the debase server. Calculate the ratio for each datasource (wpsdb, jrcdb, wmmdb, etc.) • Discard ratio = # of discards / total # of queries
If we see a datasource with a very high ratio, increase the size of the prepared statement cache associated with that datasource. Since wpsdb is the most critical to overall portal performance, make sure its discard ratio is low (<10%). If the portal implementation makes heavy usage of WCM or Personalization, pay special attention to the JCR data source. If the users are stored in the database, instead of LDAP, or if we have a lot of user data stored in the LookAside database, pay extra attention to the WMM datasource.
When monitoring performance on the database server side, the DBA should make use of Snapshot monitors to quantify the number of queries coming out of Portal. Use snapshots to capture information about the database and any connected applications at a specific time. Taken at regular intervals, they are also useful for observing trends and foreseeing potential problems.
The following metrics should be looked at in particular:
- Total DBM Agents waiting for a token
- Total DBM Agents stolen
- Max Applications Connected to DB
- Avg Applications Connected to DB
- Application Statements Committed
- Application Rollback Requests
- Internal Statements Committed
- Internal Rollbacks
- Total Transactions
- Transactions Per Second
- Average Rows Read Per Transaction
- Rows Inserted
- Rows Updated
- Rows Deleted–Rows Selected
- Total Rows Affected
- Average Rows Read Per Affected
- Total Lock Escalations
- Total Deadlocks Detected
- Total Lock Timeouts
- Total Lock Waits
- Percentage Lock Waits
- Average Lock Wait Tim (sec.ms)
- Mack Lock List Memory in Use (Kb)
These metrics should be monitored on all portal databases - wpsdb, wmmdb (if created separately), jcrdb, lmdb, fdbkdb.
Performance maintenance: keeping it fast
Once we deploy the portal solution into production for real life use, as more and more customizations, such as new pages, new portlets, new content are added or changed by either portal administrators or normal portal users if allowed, certain performance maintenance tasks must be performed to keep portal performing the way it did when it left the performance lab.
Over time, as portal configurations are added to tables, and other information is deleted, there is an increase in fragments on the hard disks where the database stores data. To keep the portal implementation running in top shape, perform tasks such as rebuilding indexes, statistics, and reorganization on a regular basis.
When Portal retrieves information from the database, it stores that information in cache so that later queries for the same information don’t have to go back to the database again. Having the correct cache size setting is important. The larger the cache size, the more likely that entries will be reused, but once memory is full, the JVM will start very expensive garbage collection processing which will degrade overall system performance. Monitor the cache size and make sure that it is close to the reasonable upper limit of actual usage, for peak performanc.
Final test should reflect user behavior
Once all applications have been deployed and tuned individually, run a performance test of the entire system using a script that reflects typical user behavior. If the portal is replacing an existing system with similar page layout and functionality, we should have statistics on user behavior that we can use to build the script. For example, if 70% of the users don’t log out of the system, then the script should not either - otherwise we won’t see the effect on load of all of those inactive sessions waiting to time out.